from colorspace import swatchplot, palette
from colorspace import sequential_hcl, diverging_hcl, heat_hcl
# List of hex colors
swatchplot(['#7FBFF5', '#2A4962', '#111111', '#633C39', '#F8A29E'],
figsize = (7, 0.5));
Visualization of color palettes in columns of color swatches. The first argument pals is very flexible and can be:
colorspace.palettes.palette, colorspace.palettes.hclpalette, colorspace.colorlib.colorobject,colorspace.palettes.hclpalettes,matplotlib.colors.LinearSegmentedColormap or matplotlib.colors.ListedColormap.Requires the matplotlib to be installed.
swatchplot(pals, show_names=True, nrow=20, n=5,
cvd=None, **kwargs)pals
show_namesbool
nrowint
20.
nint
5.
cvdNone or list
None, this is not applied. Can be set to a list of characters. Allowed: "protan", "tritan", "deutan", "desaturate" corresponding to the functions protan, tritan, deutan, desaturate.
**kwargs
matplotlib.pyplot.subplot, can be used to control e.g., figsize.
from colorspace import swatchplot, palette
from colorspace import sequential_hcl, diverging_hcl, heat_hcl
# List of hex colors
swatchplot(['#7FBFF5', '#2A4962', '#111111', '#633C39', '#F8A29E'],
           figsize = (7, 0.5));
# Create a custom 'palette' (named):
pal = palette(['#7FBFF5', '#2A4962', '#111111', '#633C39', '#F8A29E'],
              "Custom Named Palette")
swatchplot(pal, figsize = (7, 0.5));
# A HCL palette. 'n' defines the number of colors.
swatchplot(sequential_hcl("PuBu"), n = 10,
           figsize = (7, 0.5));
# Combine all three
swatchplot([['#7FBFF5', '#2A4962', '#111111', '#633C39', '#F8A29E'],
            pal, sequential_hcl("PuBu")], n = 7,
            figsize = (7, 1.5));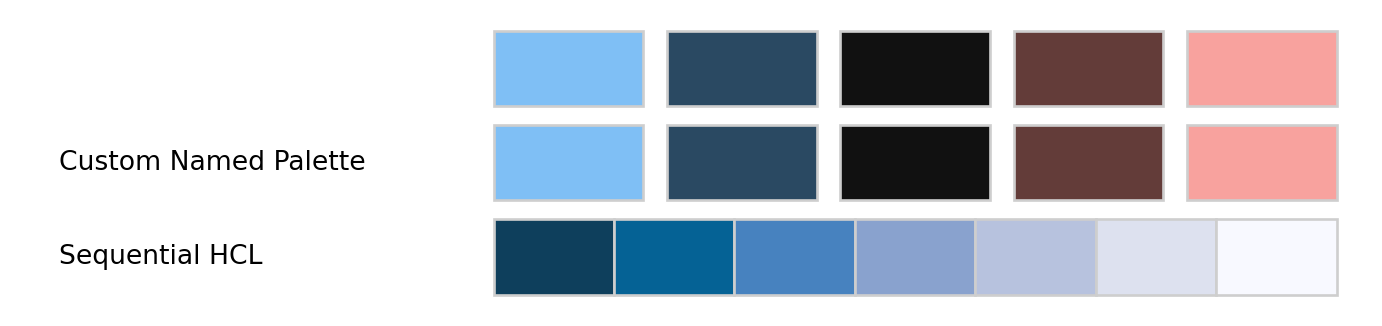
# A color object (e.g., RGB, HCL, CIELUV, ...)
from colorspace.colorlib import hexcols
cobject  = hexcols(heat_hcl()(5))
cobject.to("HCL")
print(cobject)
polarLUV color object (5 colors)
H C L
1: 359.96 100.56 50.04
22.73 95.68 60.00
44.77 91.06 69.91
67.39 82.91 79.91
90.40 29.80 90.06swatchplot(cobject, figsize = (7, 0.5));
# Using dictionaries to add subtitles
# to 'group' different palettes.
swatchplot({"Diverging": [diverging_hcl(), diverging_hcl("Red-Green")],
            "Sequential": [sequential_hcl("ag_Sunset"), sequential_hcl("OrRd")],
            "Others": [['#7FBFF5', '#2A4962', '#111111', '#633C39', '#F8A29E'],
                       pal, sequential_hcl("PuBu")]}, n = 15);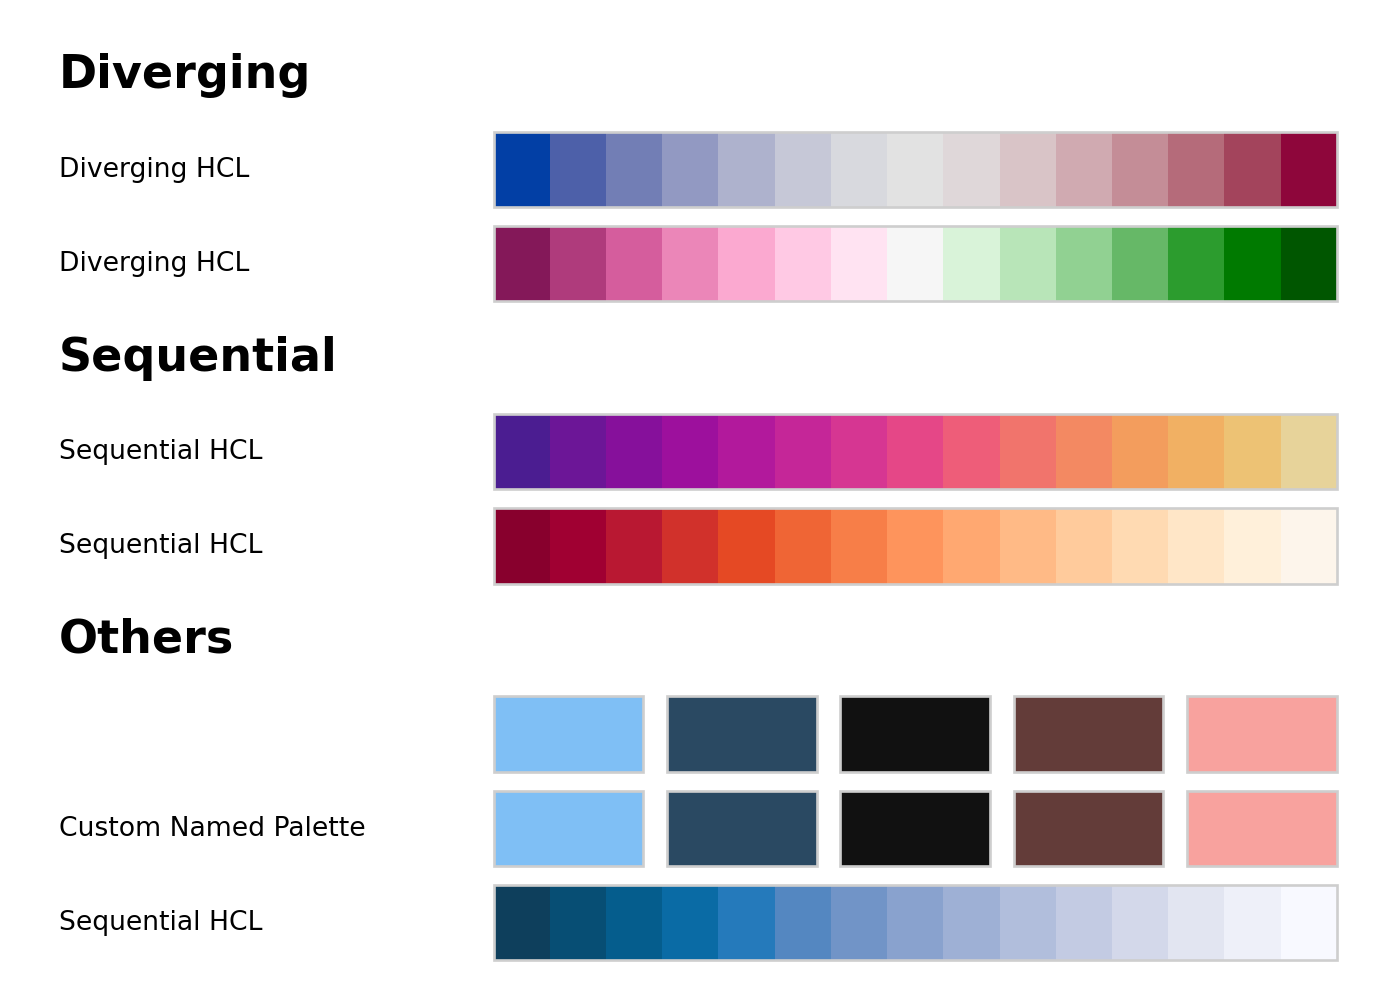
ImportError: If matplotlib is not installed.
TypeError: If nrow or n no int.
TypeError: If show_names not bool.
ValueError: If nrow or n are not positive.
ImportError: If matplotlib.pyplot cannot be imported, maybe matplotlib not installed?