from colorspace import rainbow_hcl, diverging_hcl
from colorspace import specplot
pal = rainbow_hcl()
specplot(pal.colors(21));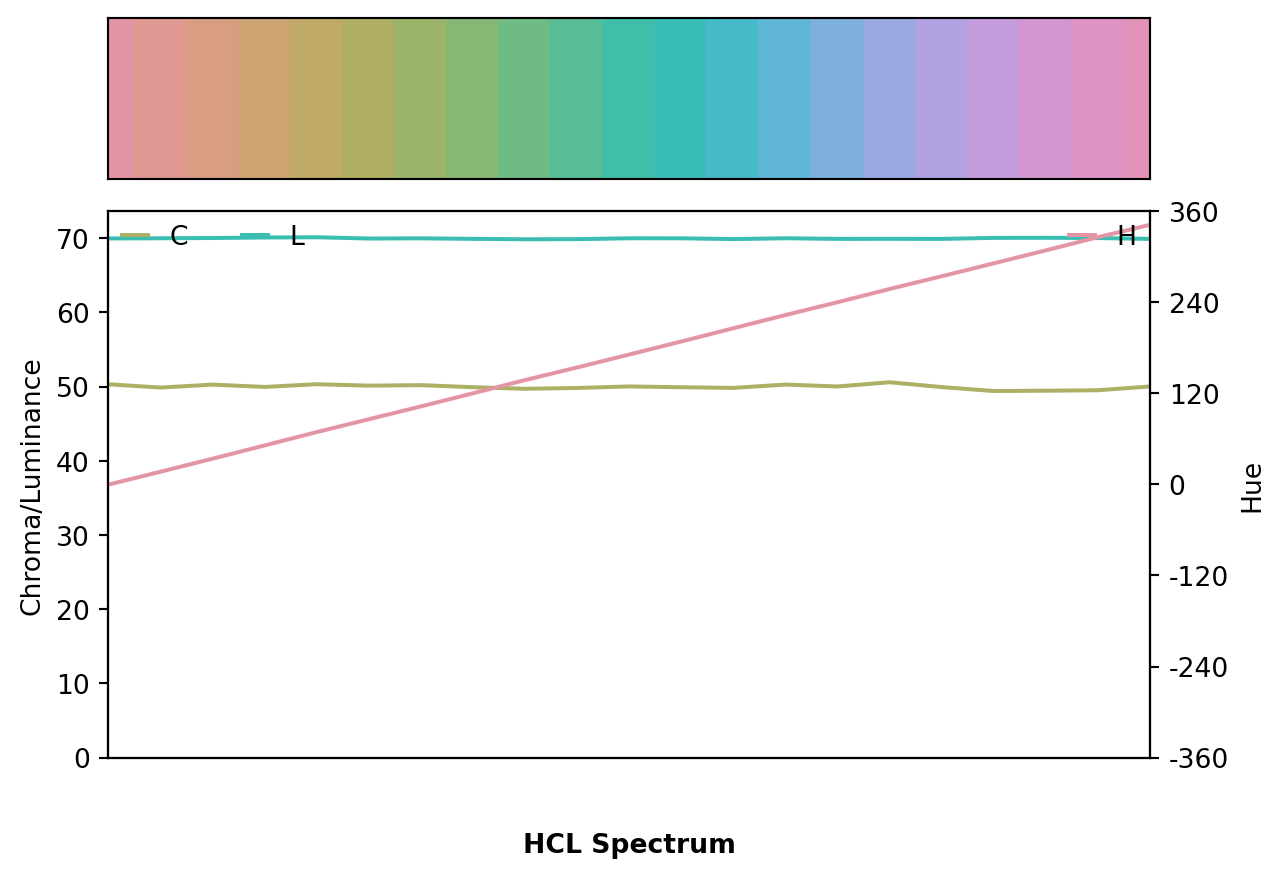
Visualization of color palettes (given as hex codes) in HCL and/or RGB coordinates.
As the hues for low-chroma colors are not (or poorly) identified, by default a smoothing is applied to the hues (fix = TRUE). Also, to avoid jumps from 0 to 360 or vice versa, the hue coordinates are shifted suitably.
If argument x is a maplotlib.colors.LinearSegmentedColormap or matplotlib.colors.ListedColormap, 256 distinct colors across the color map are drawn and visualized.
specplot(x, y=None, hcl=True, palette=True,
         fix=True, rgb=False, title=None, fig=None,
**figargs)xlist, LinearSegmentedColormap, ListedColormap
matplotlib.colors.LinearSegmentedColormap.
yNone, list, LinearSegmentedColormap
x) with the very same length as the object provided on argument x or a maplotlib.colors.LinearSegmentedColormap. Allows to draw two sets of colors for comparison, defaults to None.
hclbool
palettebool
fixbool
rgbbool
False.
titleNone or str
None (no title).
figNone, matplotlib.figure.Figure
None, a new matplotlib.figure.Figure is created.
**figargs
matplotlib.pyplot.subplot. Only has an effect if fig = None.
from colorspace import rainbow_hcl, diverging_hcl
from colorspace import specplot
pal = rainbow_hcl()
specplot(pal.colors(21));
# Show spectrum in standard RGB space
specplot(pal.colors(21), rgb = True);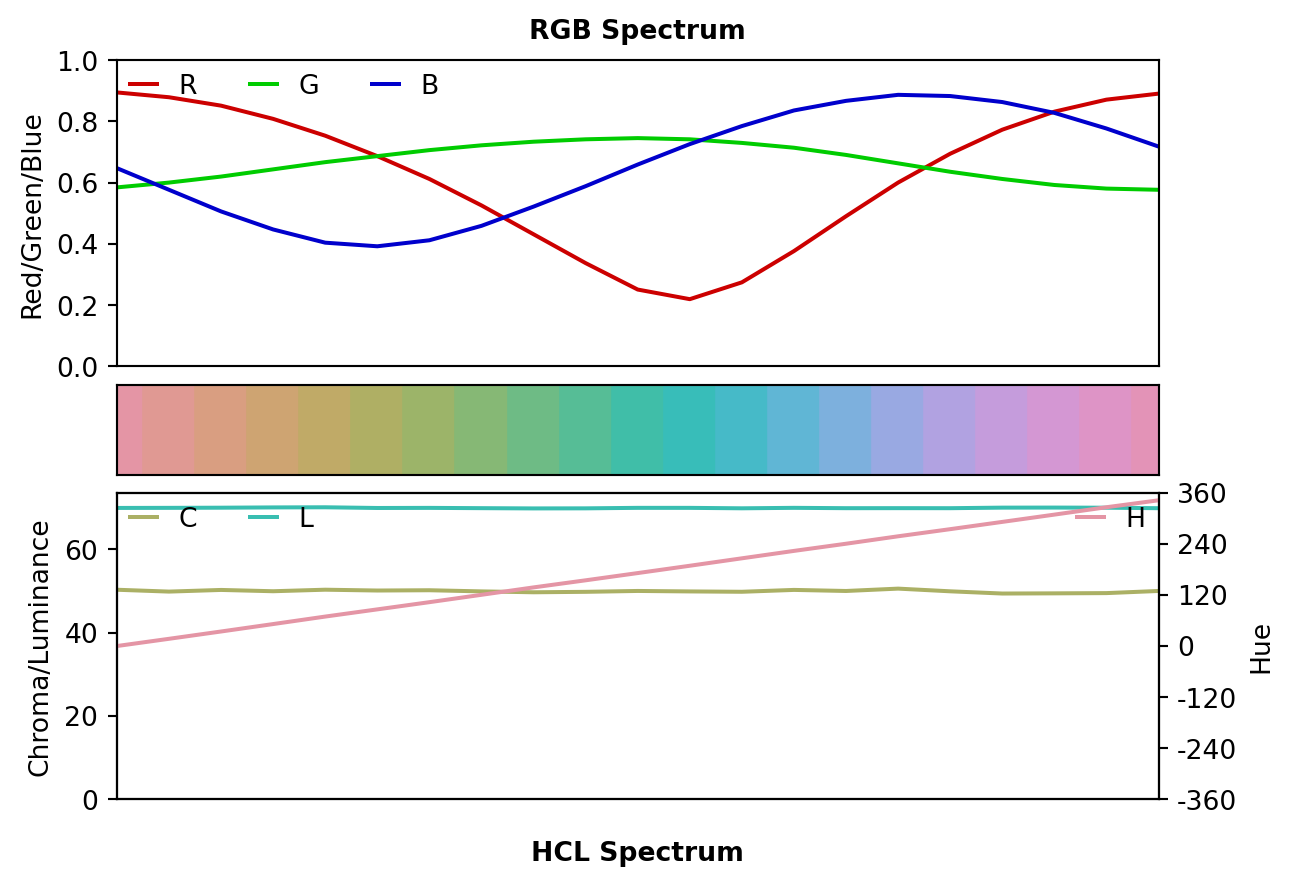
# Reduced number of colors.
# Show sRGB spectrum, hide HCL spectrum
# and color palette swatch.
specplot(pal.colors(), rgb = True, hcl = False,
         palette = False, figsize = (8, 3));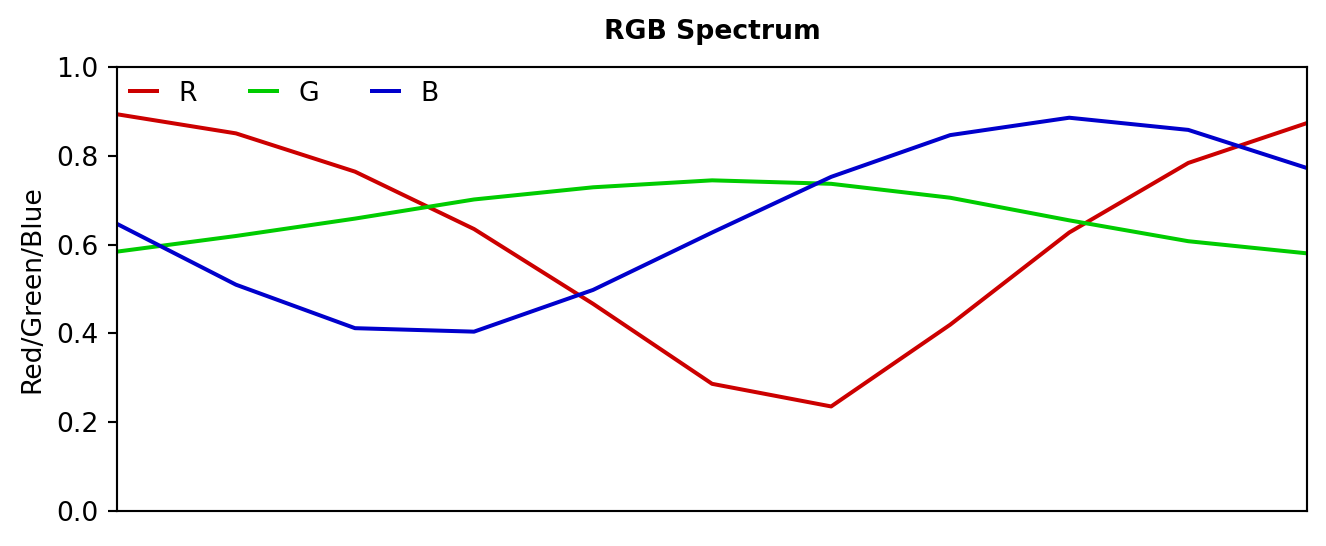
# Comparing full diverging_hcl() color spectrum to
# a LinearSegmentedColormap (cmap) with only 5 colors
# (an extreme example)
specplot(diverging_hcl("Green-Orange").colors(101),
         diverging_hcl("Green-Orange").cmap(5),
         rgb = True, figsize = (8, 3));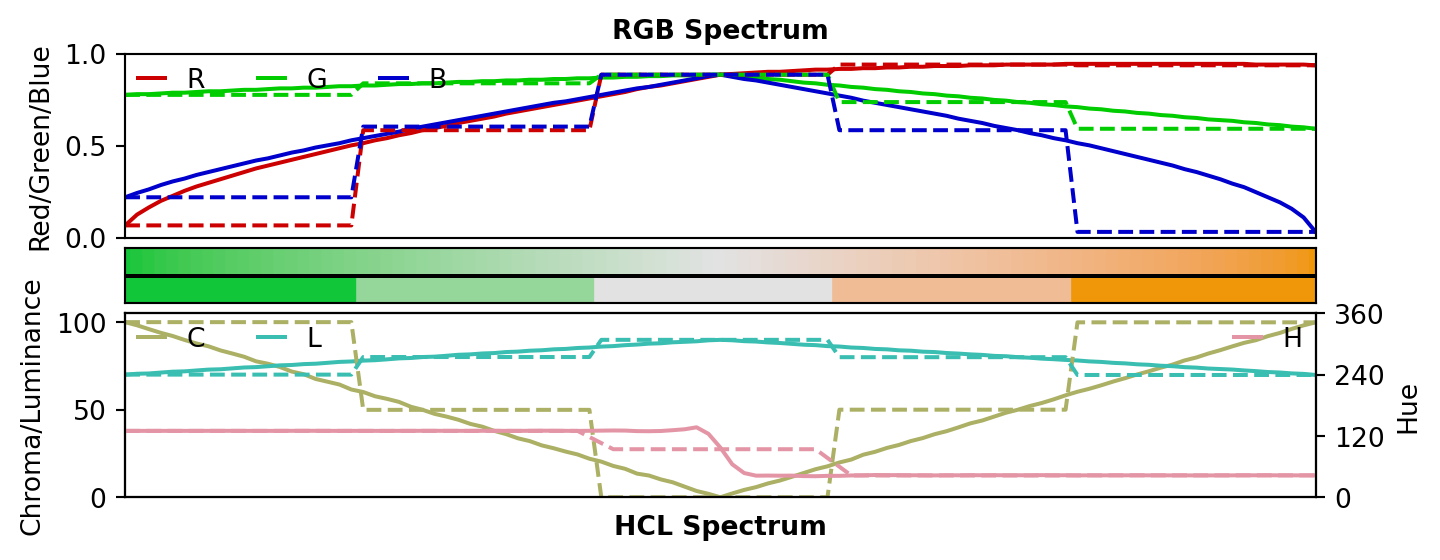
# Same as above using .cmap() default with N = 256 colors
specplot(diverging_hcl("Green-Orange").colors(101),
         diverging_hcl("Green-Orange").cmap(),
         rgb = True, figsize = (8, 3));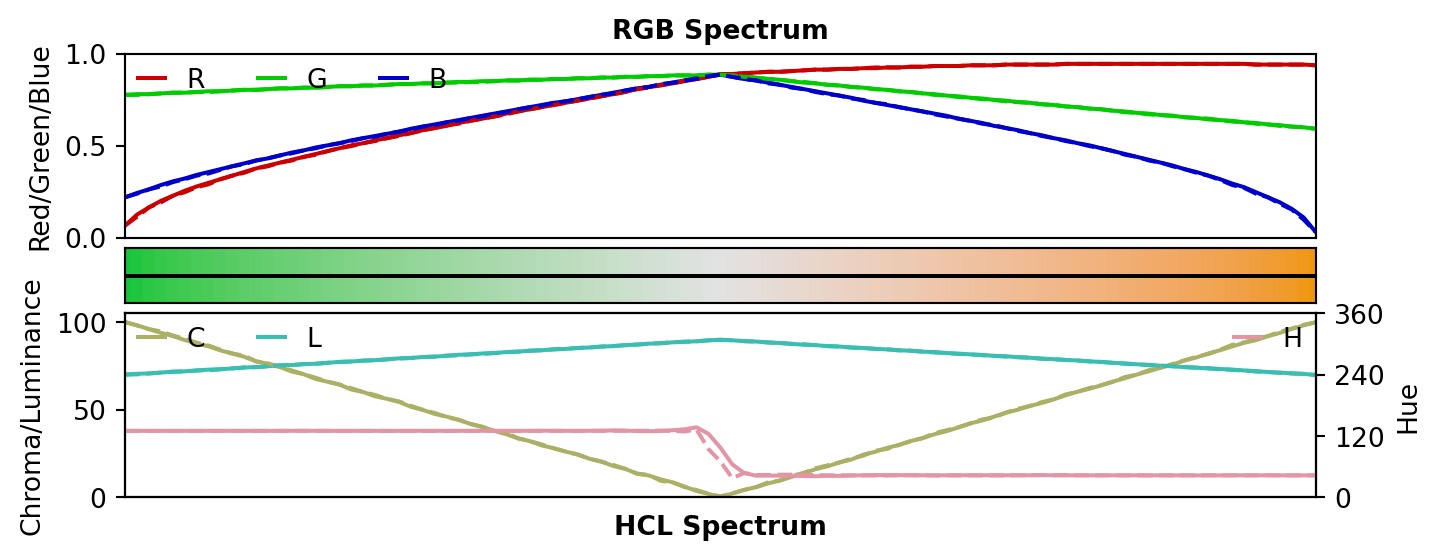
ImportError: If matplotlib is not installed.
TypeError: If x is not list or matplotlib.colors.LinearSegmentedColormap.
TypeError: If y is neither a list nor None.
ValueError: If x contains str which can not be converted to hex colors.
ValueError: If y contains str which can not be converted to hex colors.
ValueError: If y is not the same length as y. Only checked if y is not None.
TypeError: If either rgb, hcl, or palette is not bool.
ValueError: If all, rgb, hcl and palette are set to False as this would result in an empty plot.
TypeError: If 'title' is neither None nor str.