from colorspace import rainbow_hcl, deutan, palette
from colorspace import specplot, swatchplot
# Drawing 100 colors along the HCL rainbow color palette
cols = rainbow_hcl()(100)
specplot(cols);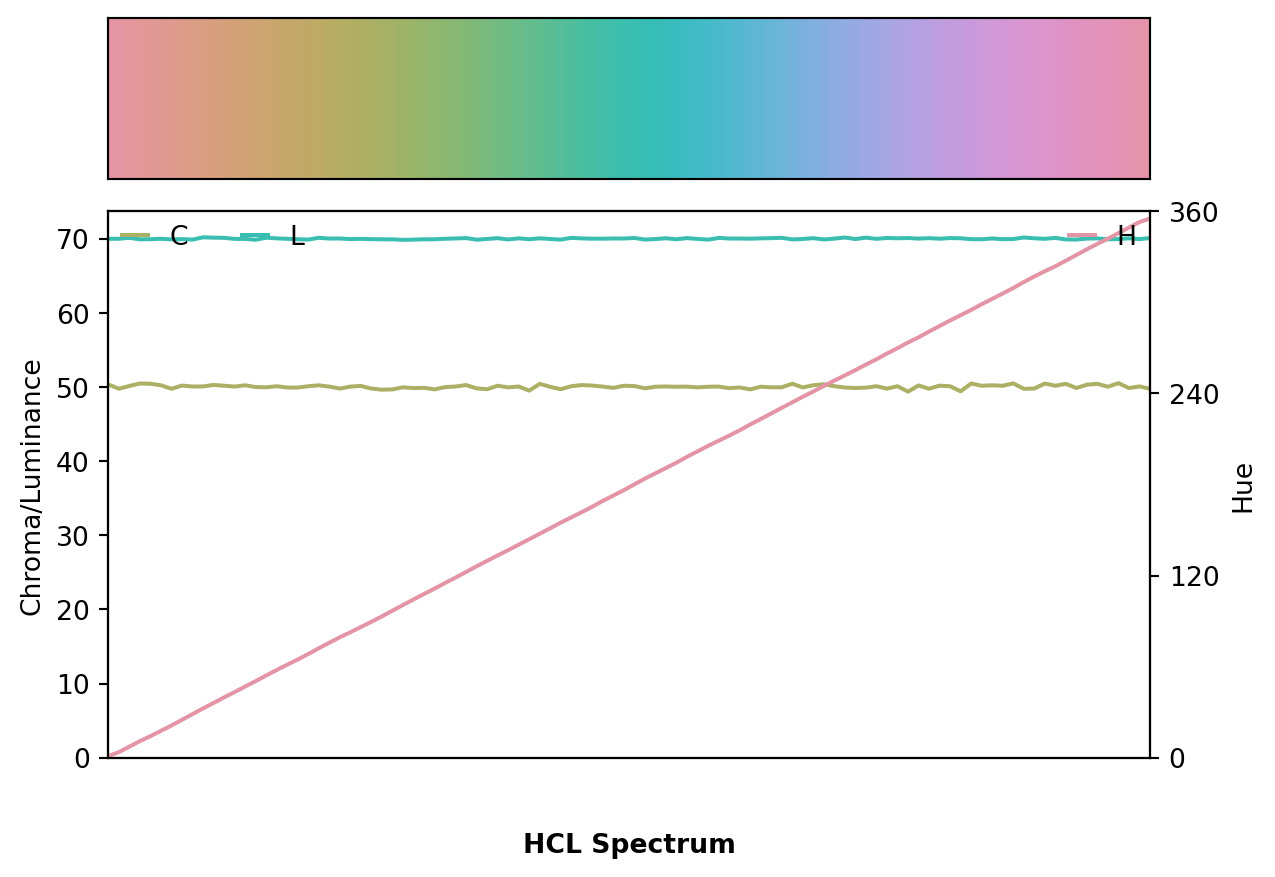
Transformation of colors by simulating color vision deficiencies, based on a CVD transform matrix. This function is an interface to the CVD object and returns simulated colors for deuteranope vision (green-yellow-red weakness).
See also protan, tritan, desaturate, and cvd_image.
deutan(cols, severity=1.0, linear=True)colslist, colorobject, matplotlib.colors.LinearSegmentedColormap
severityfloat
[0., 1.]. Zero means no deficiency, one maximum deficiency, defaults to 1..
linearbool
False, the transformation is applied to the gamma-corrected sRGB coordinates (as in the Machado et al. 2009 supplementary materials).
colorobject: Returns an object of the same type as the input object cols with modified colors as people with deuteranomaly see these colors (simulated).
from colorspace import rainbow_hcl, deutan, palette
from colorspace import specplot, swatchplot
# Drawing 100 colors along the HCL rainbow color palette
cols = rainbow_hcl()(100)
specplot(cols);
specplot(deutan(cols));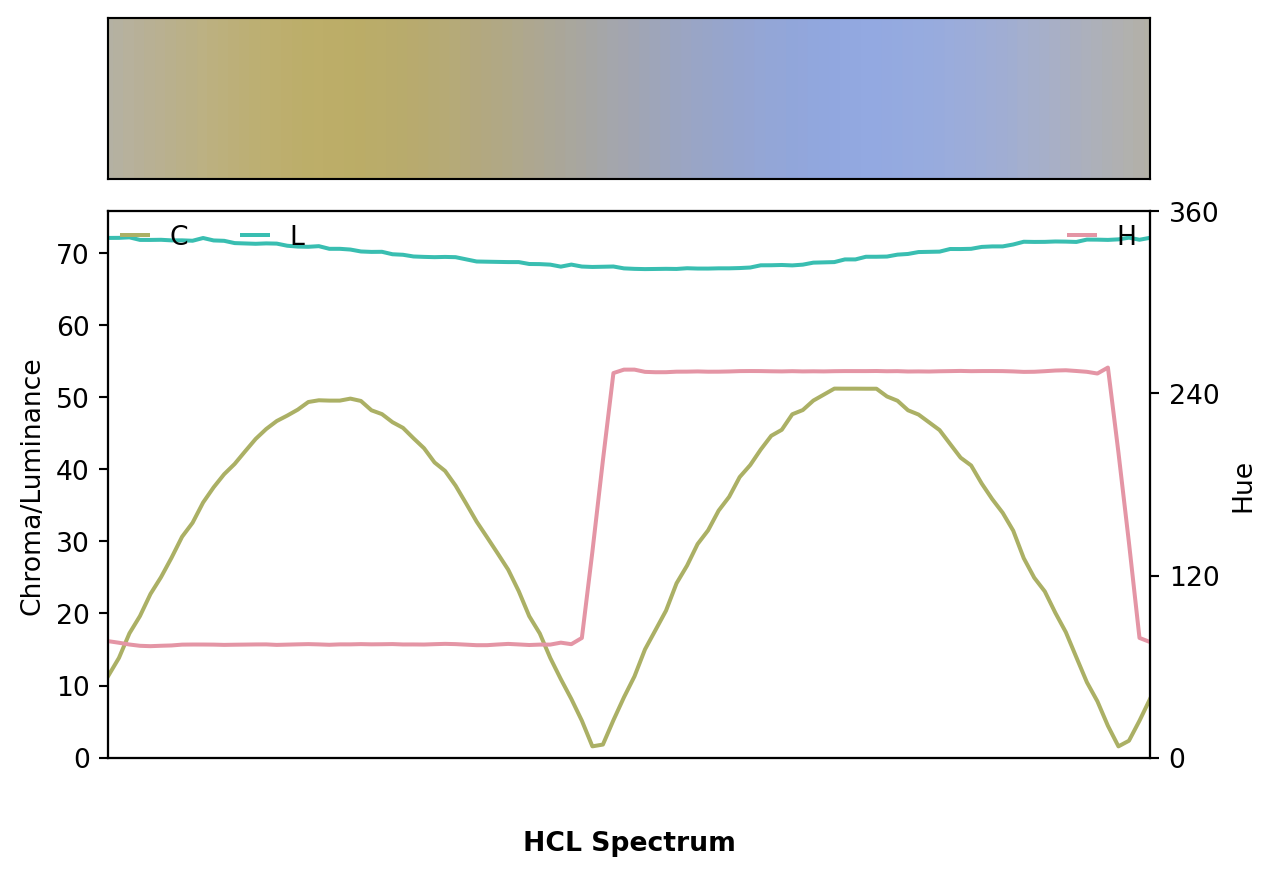
specplot(deutan(cols, 0.5));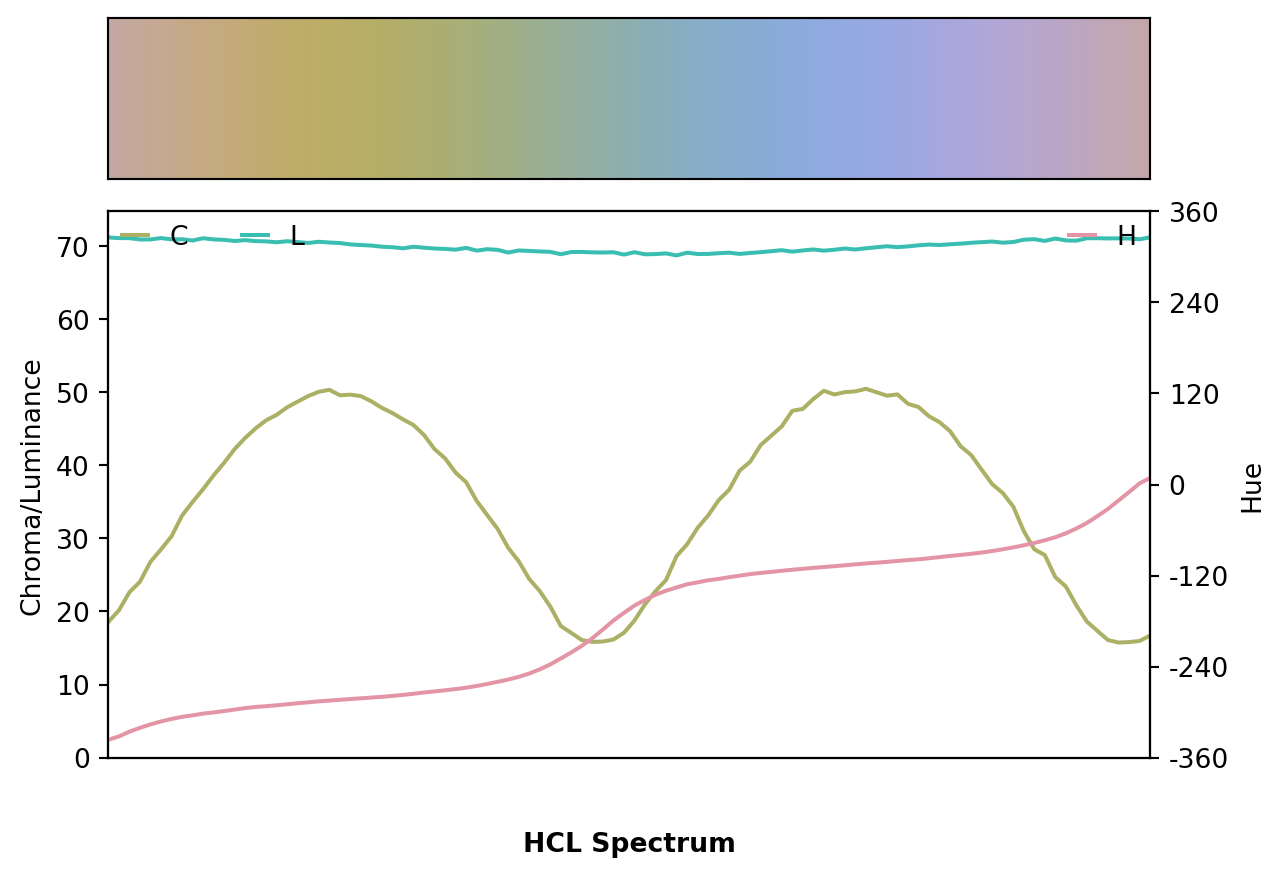
# List of (hex) colors
cols = ["magenta", "red", "orange", "#F2F204", "#6BF204", "#4DA00D"]
deutan(cols);
# Visualize original and simulated color swatches
swatchplot([cols, deutan(cols)],
show_names = False, figsize = (5, 1.5));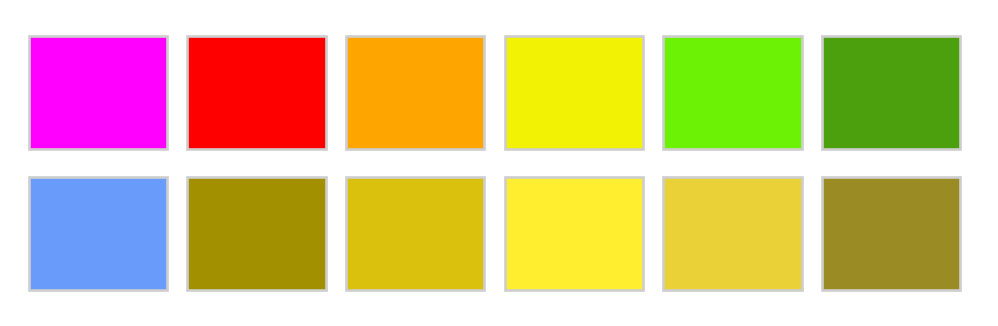
# From palette object
pal = palette(cols, name = "custom palette")
deutan(pal)
['#689BFA', '#A39000', '#D9C10E', '#FFED2F', '#E9D137', '#9B8B25']# From cmap (returns cmap)
deutan(pal.cmap())