# Importing modules
from colorspace import *
from colorspace.colorlib import *
# Custom list of hex colors (n = 5)
hexlist    = ["#BCBE57", "#DEDFC0", "#F1F1F1", "#F7D3E7", "#FB99D7"]
hexlist
['#BCBE57', '#DEDFC0', '#F1F1F1', '#F7D3E7', '#FB99D7']This function is intended to be used by the GUI (choose_palette) to visualize the color palette selected for a series of different types of plots. It can, however, also be used directly if needed.
demoplot(colors, type_, n=7, ax=None, **kwargs)colors
type_str
nint
colors is a palette where a dedicated number of colors must be drawn first. Defaults to 7.
titleNone, str
axNone, matplotlib.axes.Axes
None a new matplotlib figure will be created. If ax inherits from matplotlib.axes.Axes this object will be used to create the demoplot. Handy to create multiple subplots. Forwarded to different plot types.
**kwargs
# Importing modules
from colorspace import *
from colorspace.colorlib import *
# Custom list of hex colors (n = 5)
hexlist = ["#BCBE57", "#DEDFC0", "#F1F1F1", "#F7D3E7", "#FB99D7"]
hexlist['#BCBE57', '#DEDFC0', '#F1F1F1', '#F7D3E7', '#FB99D7']# A (HCL based) colorobject with (n = 3)
colorobj = HCL([0, 90, 180], [60, 60, 60], [60, 60, 60])
colorobjpolarLUV color object (3 colors)
H C L
1: 0.00 60.00 60.00
90.00 60.00 60.00
180.00 60.00 60.00# Default diverging HCL palette
hclpalette = diverging_hcl()
hclpalette<colorspace.palettes.diverging_hcl at 0x7fc4d0b25010># Default color palette shipped with the package
berlin = hcl_palettes(name = "Berlin").get_palettes()[0]
berlinPalette Name: Berlin
Type: Advanced: Diverging
Inspired by: Crameri's sico palettes
c1 60
cmax 80
fixup True
gui 1
h1 240
h2 15
l1 75
l2 5
p1 1.2
p2 1.5# Demoplots
demoplot(hexlist, "Bar");
demoplot(colorobj, "Lines");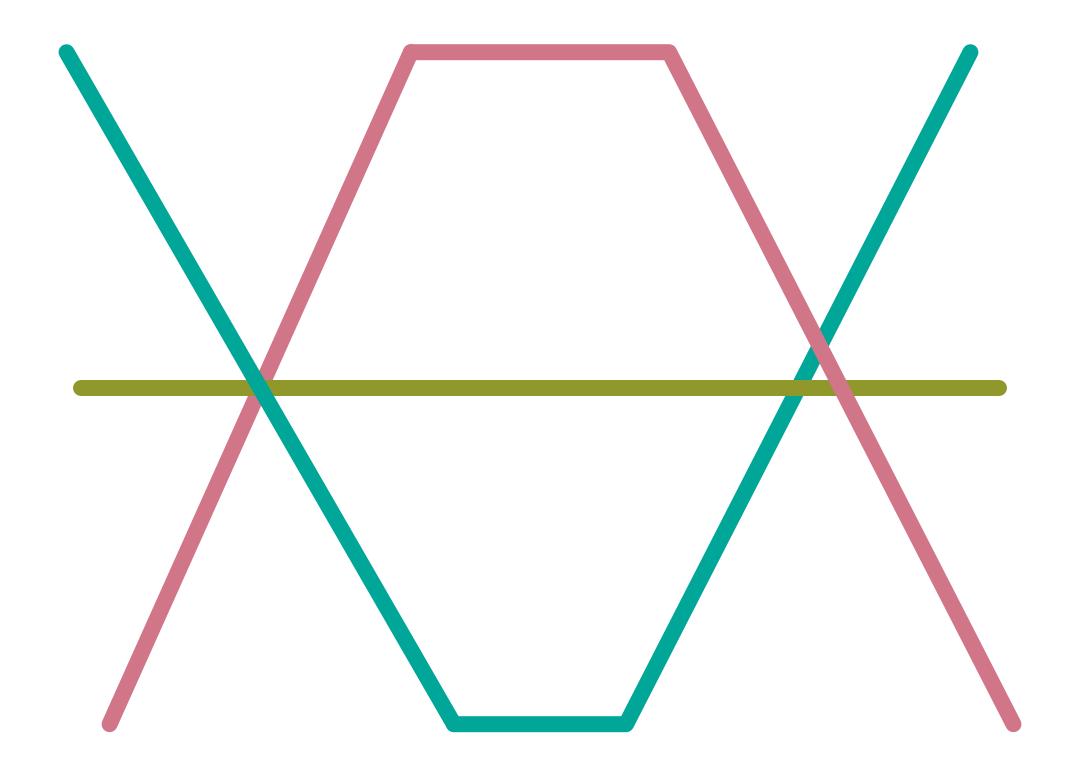
demoplot(hclpalette, "Pie", n = 4);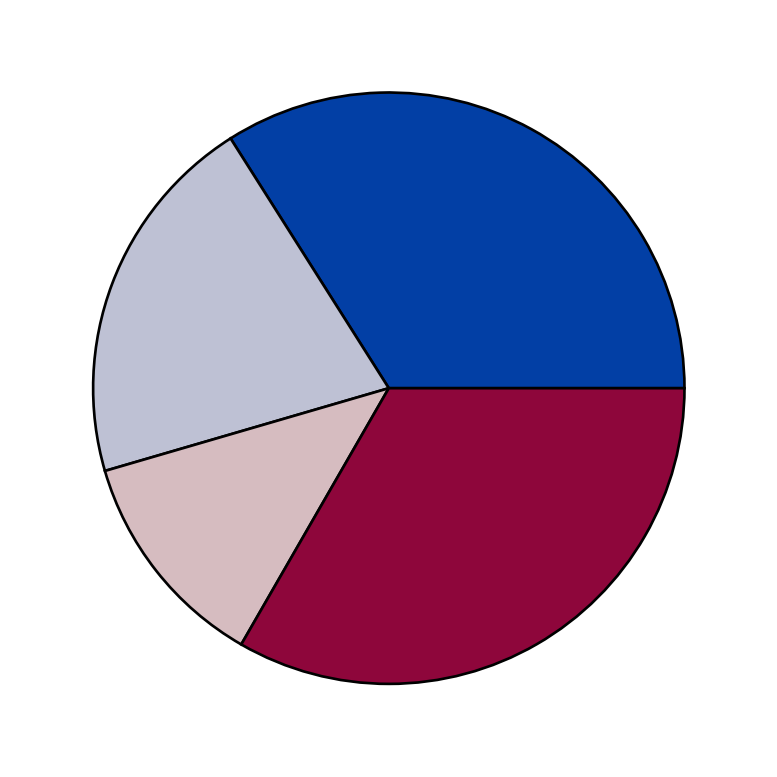
demoplot(berlin.colors(), "Matrix", n = 11);
# Using custom subplots and plot titles
from matplotlib import pyplot as plt
from colorspace import protan, deutan, desaturate
fig, axes = plt.subplots(2, 2)
colors = diverging_hcl("Green-Orange").colors(7)
demoplot(colors, "Bar",
         title = "Original", ax = axes[0, 0]);
demoplot(protan(colors), "Bar",
         title = "Protanope vision", ax = axes[0, 1]);
demoplot(deutan(colors), "Bar",
         title = "Deuteranope vision", ax = axes[1, 0]);
demoplot(desaturate(colors), "Bar",
         title = "Desaturated", ax = axes[1, 1]);
plt.show()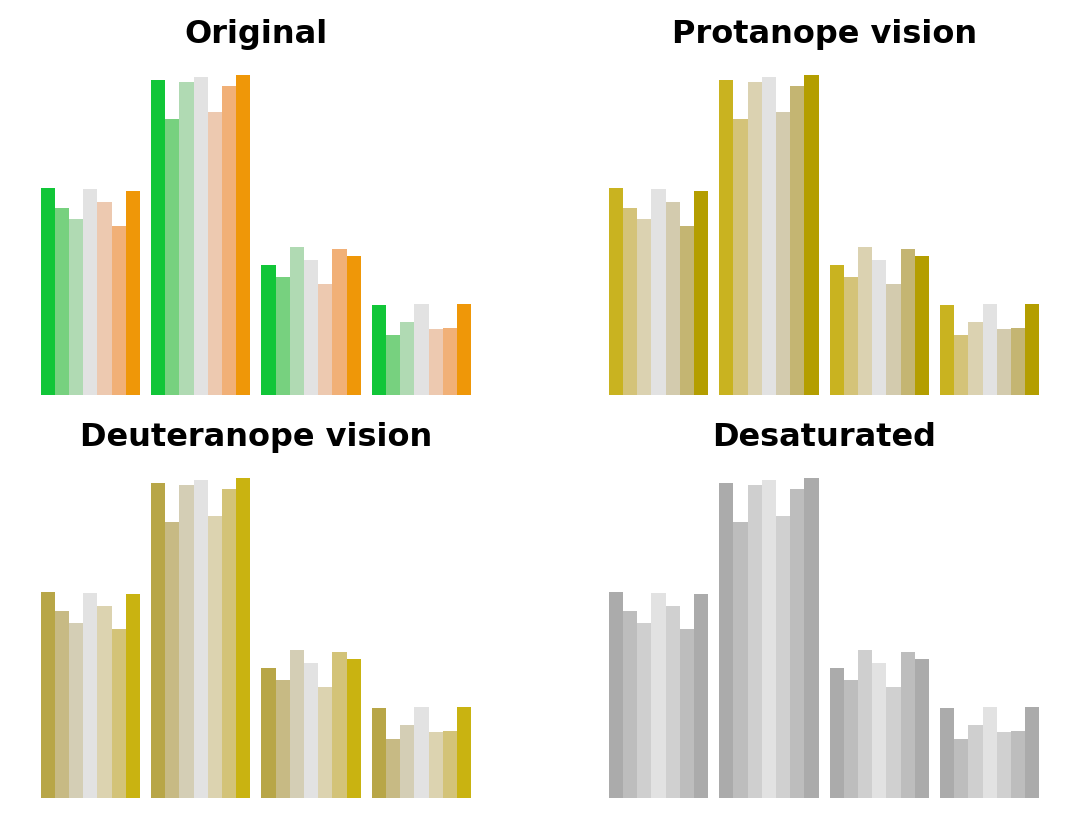
TypeError: If type_ is not a str.
ValueError: If type_ is not an available demo plot type.
TypeError: If n is not int.
ValueError: n must be a positive int.