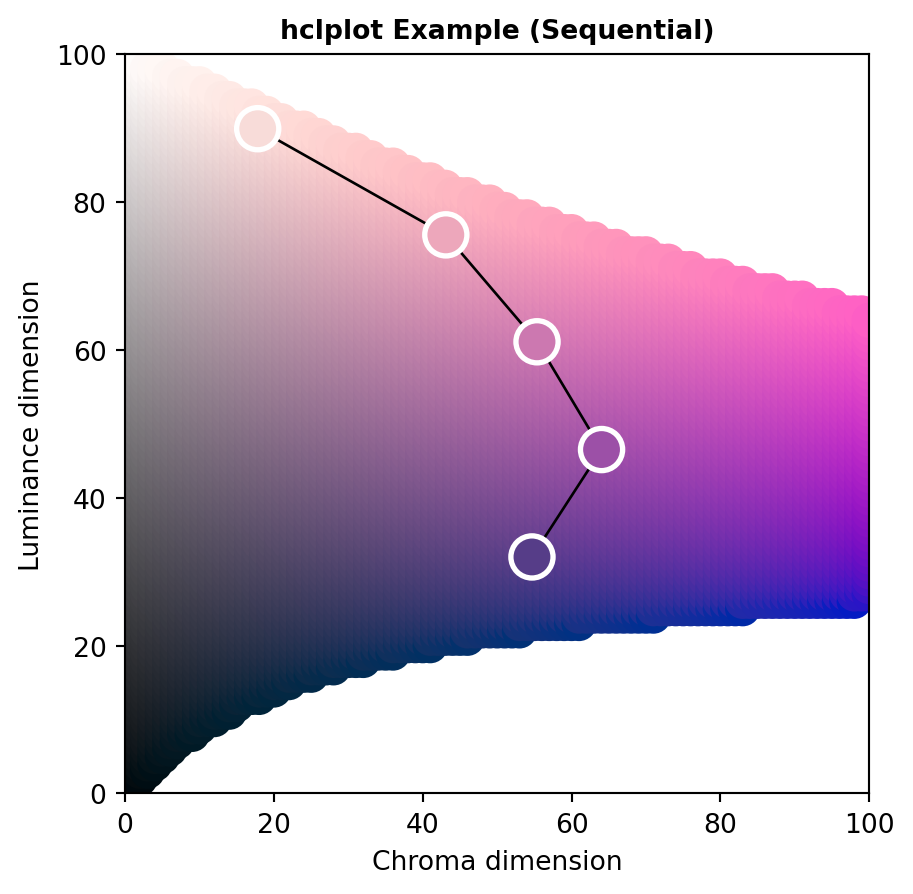
The function hclplot is an auxiliary function for illustrating the trajectories of color palettes in two-dimensional HCL space projections. It collapses over one of the three coordinates (either the hue H or the luminance L) and displays a heatmap of colors combining the remaining two dimensions. The coordinates for the given color palette are highlighted to bring out its trajectory.
The function hclplot has been designed to work well with the hcl_palettes in this package. While it is possible to apply it to other color palettes as well, the results might look weird or confusing if these palettes are constructed very differently.
More specifically, the following palettes can be visualized well:
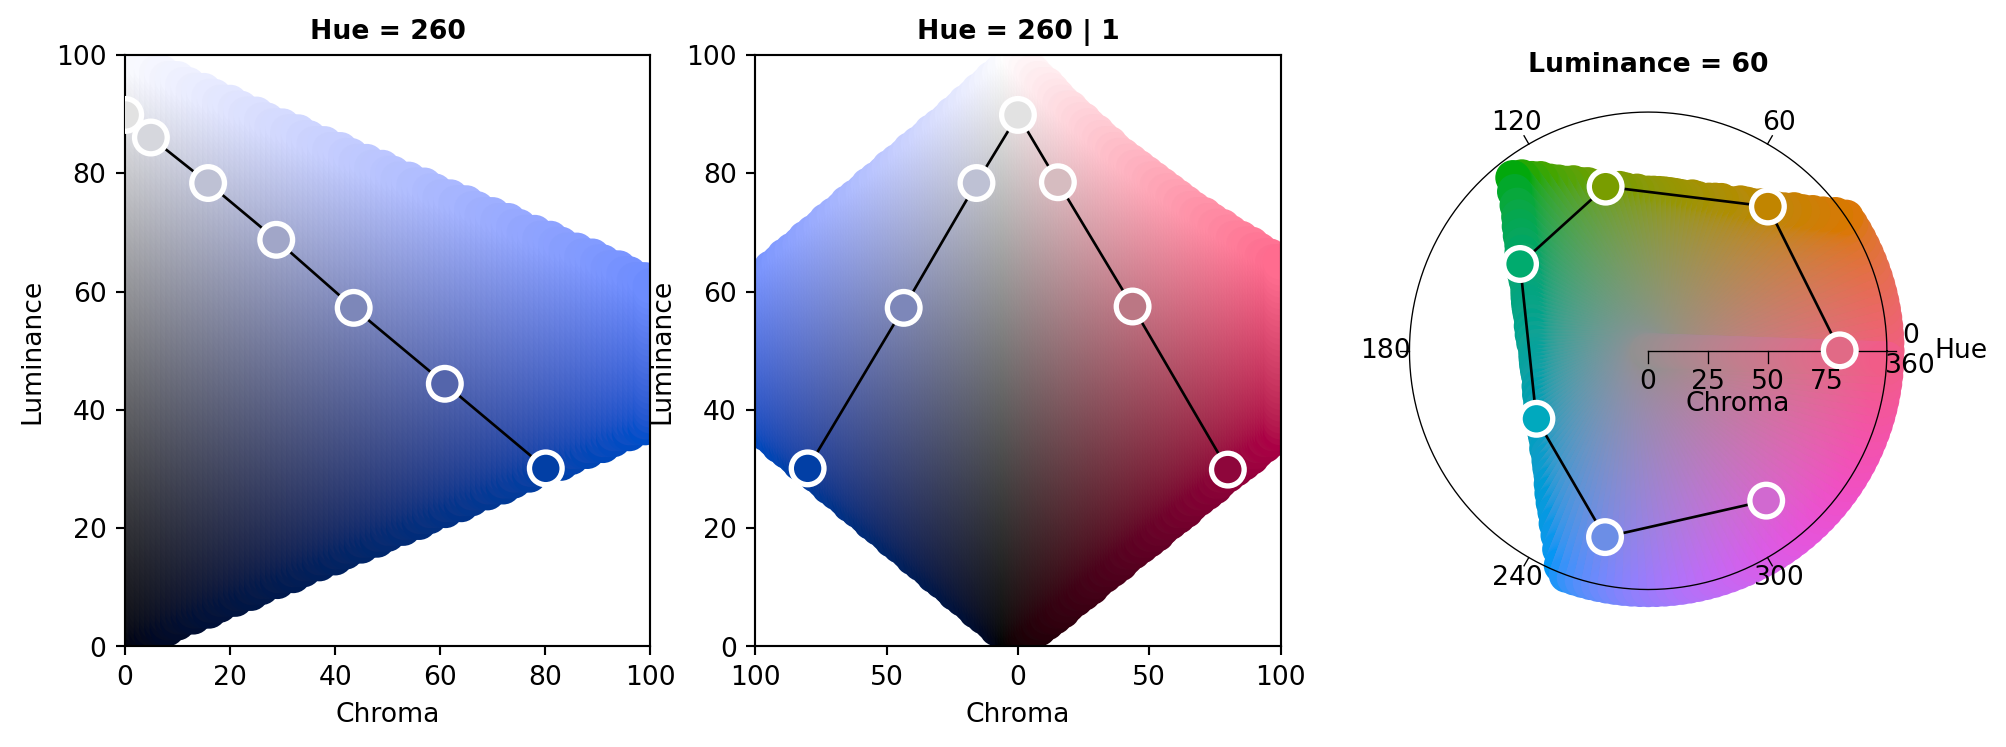
Qualitative with (approximately) constant luminance. In this case, hclplot shows a hue-chroma plane (in polar coordinates), keeping luminance at a fixed level (by default displayed in the main title of the plot). If the luminance is, in fact, not approximately constant, the luminance varies along with hue and chroma, using a simple linear function (fitted by least squares). hclplot shows a chroma-luminance plane, keeping hue at a fixed level (by default displayed in the main title of the plot). If the hue is, in fact, not approximately constant, the hue varies along with chroma and luminance, using a simple linear function (fitted by least squares.
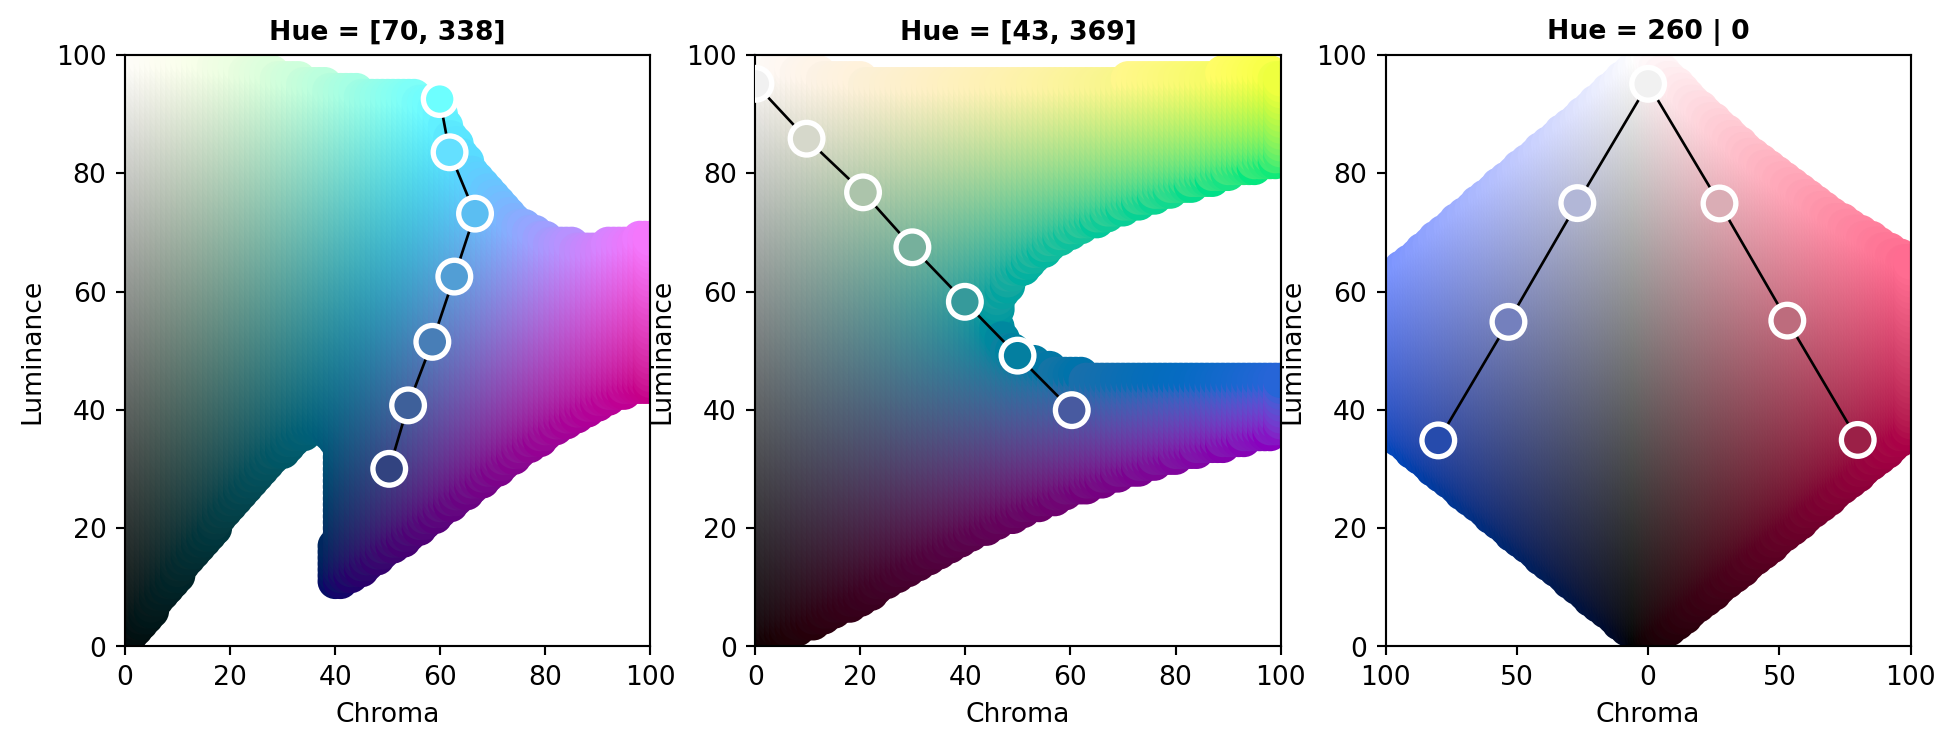
Diverging with two (approximately) constant hues: This case is visualized with two back-to-back sequential displays.
To infer the type of display to use, by default, the following heuristic is used: If luminance is not approximately constant (range > 10) and follows rougly a triangular pattern, a diverging display is used. If luminance is not constant and follows roughly a linear pattern, a sequential display is used. Otherwise a qualitative display is used.
An object which can be converted into a hexcols object.
_typeNone, str
Specifying which type of palette should be visualized ("qualitative", "sequential", or "diverging"). For qualitative palettes a hue-chroma plane is used, otherwise a chroma-luminance plane. By default (_type = None) the type is inferred from the luminance trajectory corresponding to x.
hNone, int, float
If int or float, it must be within [-360, 360]
cNone, int, float
If int or float, it must be positive
lNone, int, float
If int or float, it must be positive
axesbool
Wheter or not axes should be drawn, defaults to True.
linewidthint, float, None
Line width, if set 0 or None the line connecting the colors of the palette will be suppressed.
sint, float, None
Marker size, defaults to 150. If set 0 or None the position of the colors of the palette will be suppressed.
**kwargs
Allowed to overwrite some default settings such as title (str), xlabel (str), ylabel (str), figsize (forwarded to pyplot.figure). xlabel/ylabel only used for qualitative and diverging plots. A matplotlib axis can be provided via ax (object of type matplotlib.axes._axes.Axes) which allows to draw multiple HCL spaces on one figure.
Return
No return, visualizes the palette and HCL space either on a new figure or on an existing axis (if ax is provided, see **kwargs).
Examples
# Sequential HCL palette, hclplot with all available optionsfrom colorspace import sequential_hcl, hclplotx = sequential_hcl("PurpOr")(5)hclplot(x, xlabel ="Chroma dimension", ylabel ="Luminance dimension", title ="hclplot Example (Sequential)", figsize = (5, 5), s =250);
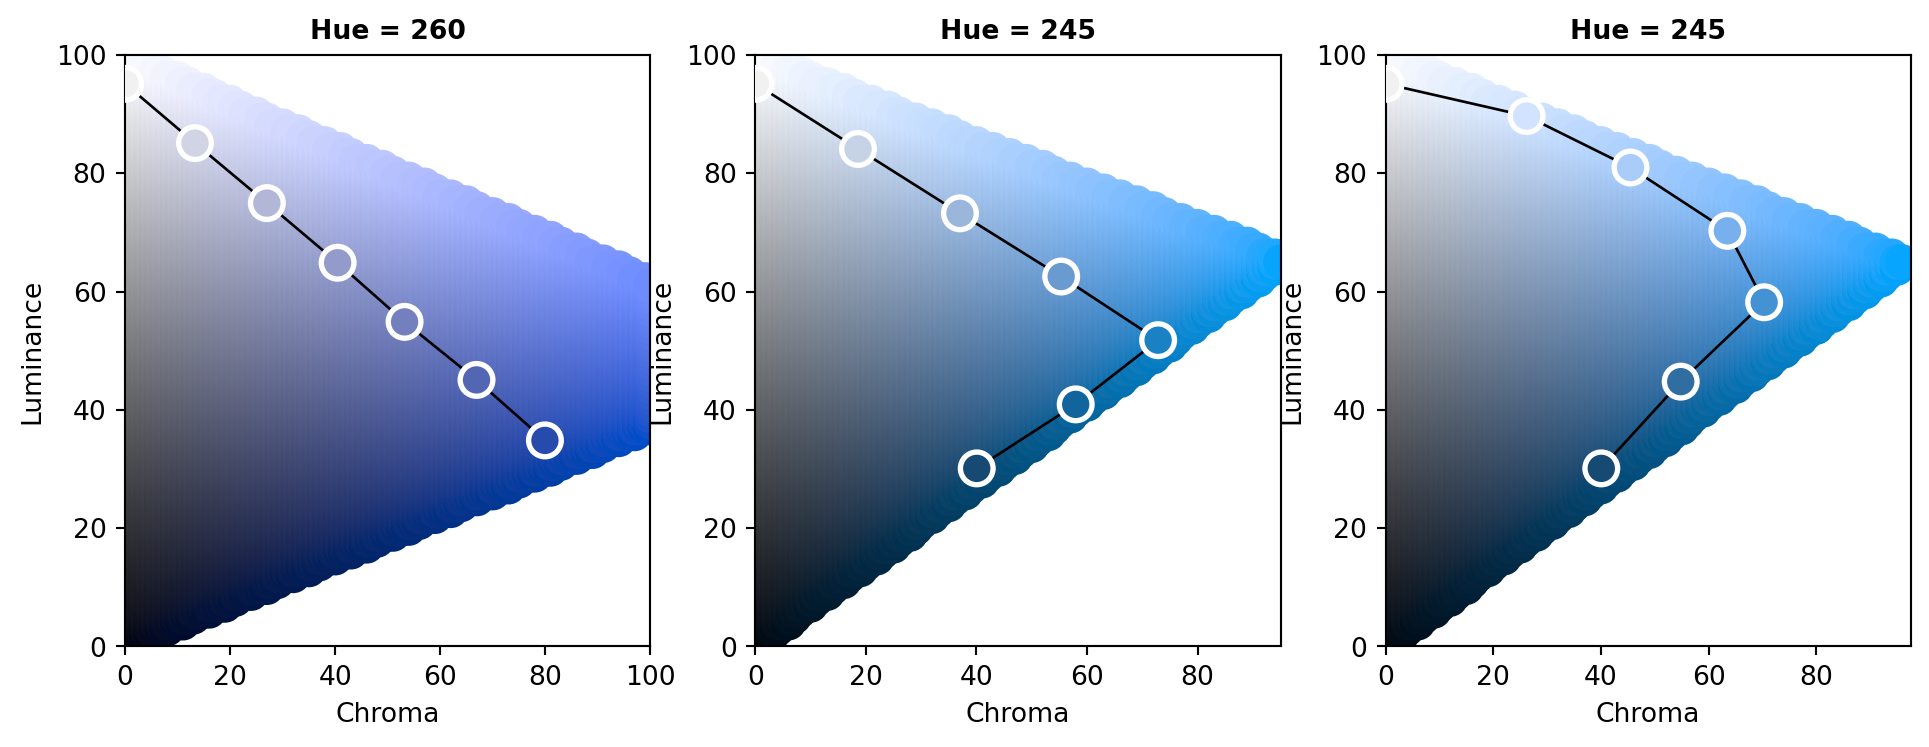
# Multiple subplotsimport matplotlib.pyplot as plt from colorspace import sequential_hcl, hclplot# Three different palettes pal1 = sequential_hcl(h =260, c =80, l = [35, 95], power =1)pal2 = sequential_hcl(h =245, c = [40, 75, 0], l = [30, 95], power =1)pal3 = sequential_hcl(h =245, c = [40, 75, 0], l = [30, 95], power = [0.8, 1.4])