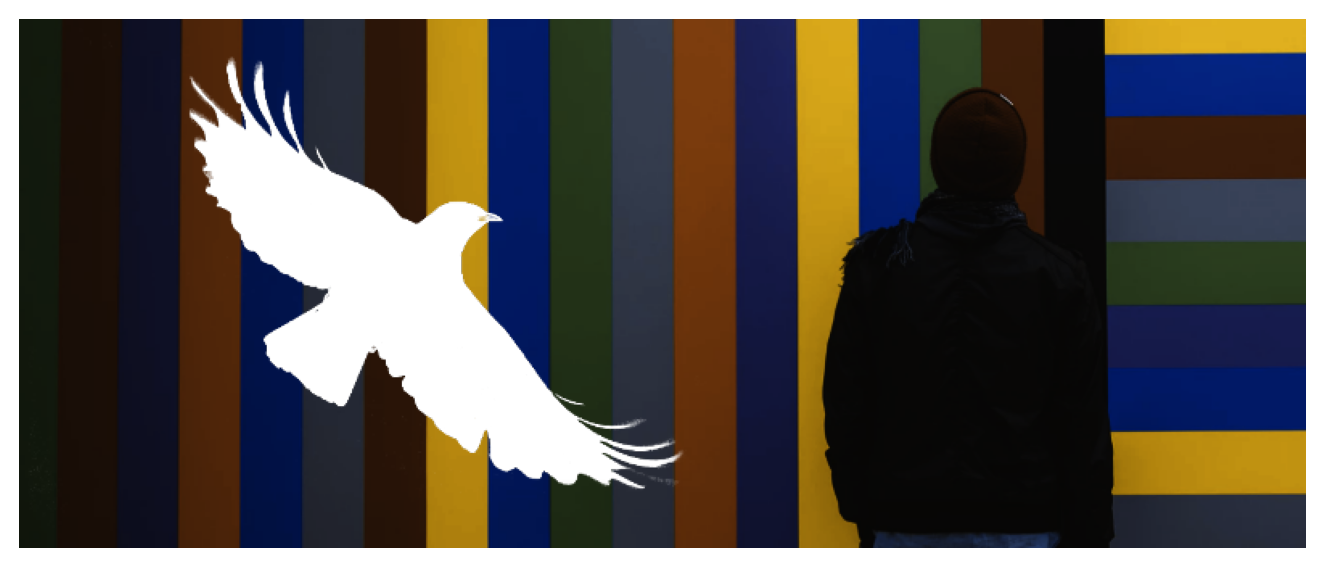
Simulate color deficiencies on png, jpg, and jpeg files. Takes an existing pixel image and simulates different color vision deficiencies.
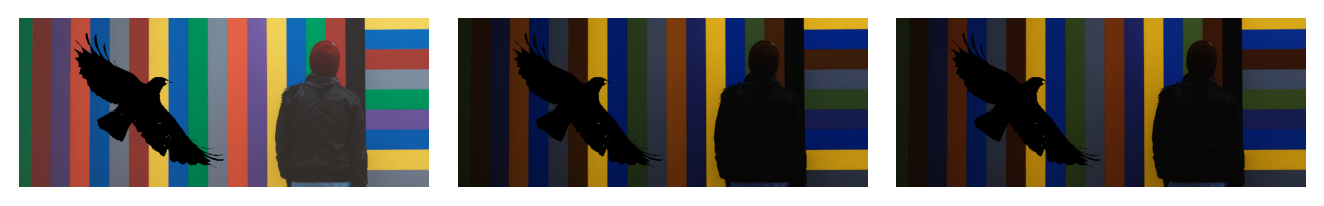
The function displays a matplotlib figure if output = None. If output is set, a new figure will be stored with simulated colors. If only one color vision deficiency is defined (e.g., cvd = "desaturate") a figure of the same type and size as the input figure is created. When multiple cvd’s are specified, a multi-panel plot will be created.
Requires the Python modules matplotlib and imageio to be installed.
Name of the figure which should be converted (png/jpg/jpeg). If image = "DEMO" the package demo figure is used.
cvdstr, list
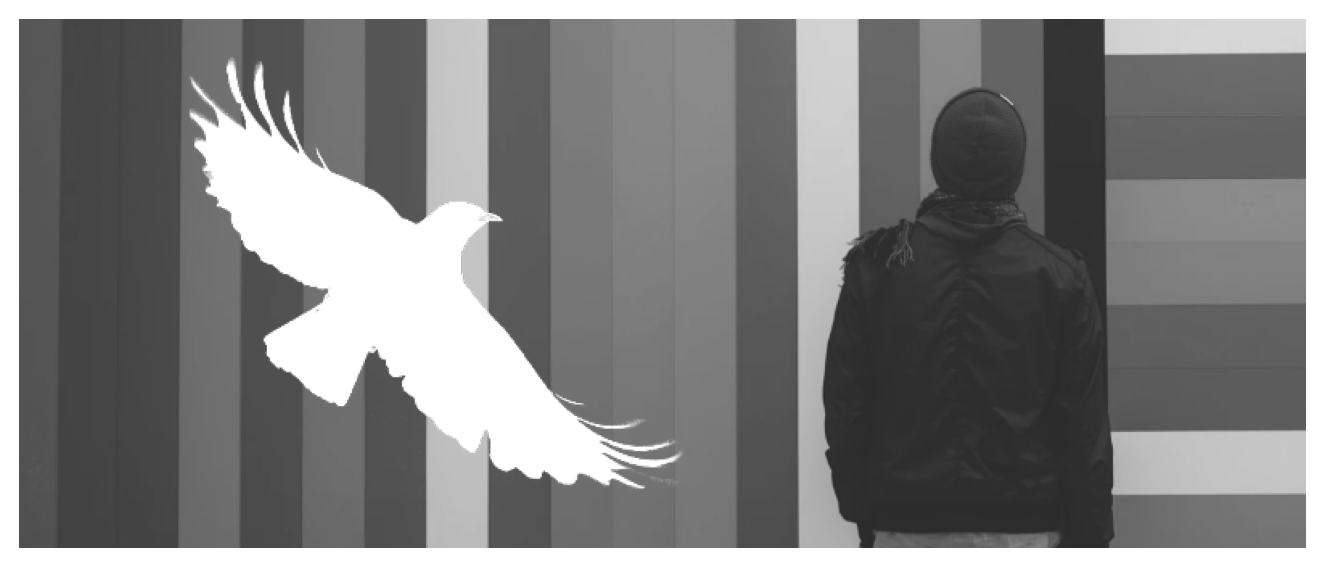
Color vision deficiency or deficiencies. Allowed types are "deutan", "protan", "tritan", "desaturated", and "original" (unmodified).
severityfloat
How severe the color vision deficiency is ([0.,1.]). Also used as the amount of desaturation if cvd includes "desaturate".
outputNone, str
If None an interactive plotting window will be opened. A str (file name/path) can be given to write the result to disc.
dropalphabool
Drop alpha channel, defaults to False. Only useful for png figures having an alpha channel.
Return
Returns a matplotlib.figure.Figure object if output = None, else the return of the function is identical to output; the figure which has just been created.
Examples
from colorspace import cvd_imagecvd_image("DEMO", "deutan", 0.5);
/opt/hostedtoolcache/Python/3.14.2/x64/lib/python3.14/site-packages/colorspace/cvd_image.py:135: UserWarning:

Ignoring specified arguments in this call because figure with num: 1 already exists