# Exemplarily for diverging_hcl, works for
# all other HCL palettes as well.
from colorspace import diverging_hcl
pal = diverging_hcl()
pal.swatchplot(figsize = (8, 2))

Interfacing the main swatchplot function. Plotting the spectrum of the current color palette.
rainbow_hcl.swatchplot(n=7, **kwargs)nint
**kwargs
# Exemplarily for diverging_hcl, works for
# all other HCL palettes as well.
from colorspace import diverging_hcl
pal = diverging_hcl()
pal.swatchplot(figsize = (8, 2))
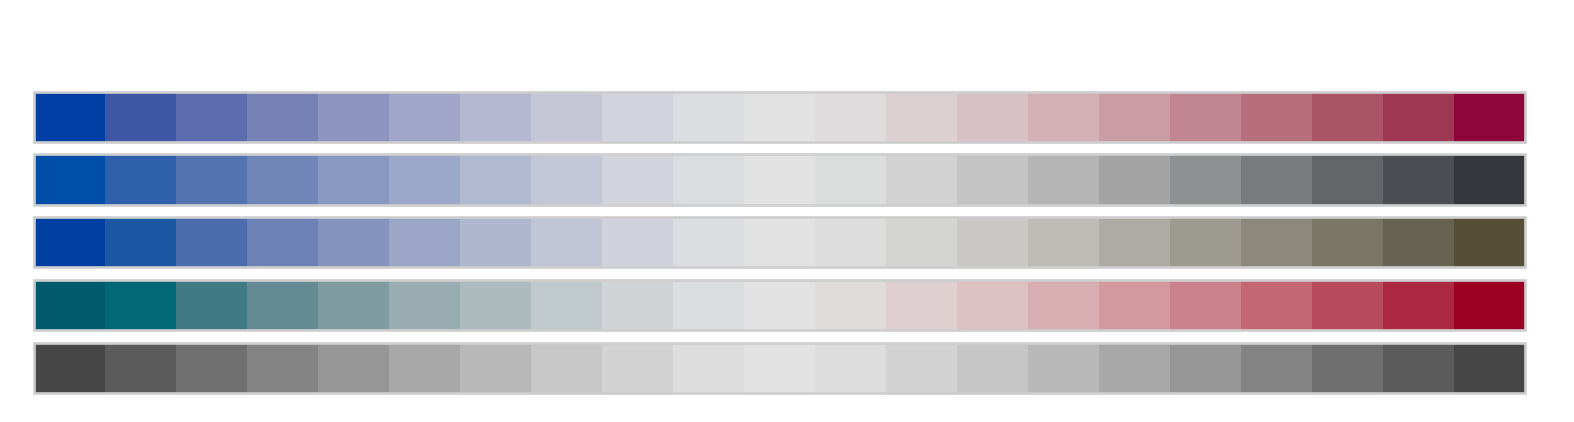
# Handing over a series of additional arguments
# forwarded to swatchplot()
pal.swatchplot(n = 21, figsize = (8, 2),
               show_names = False, cvd = "deutan")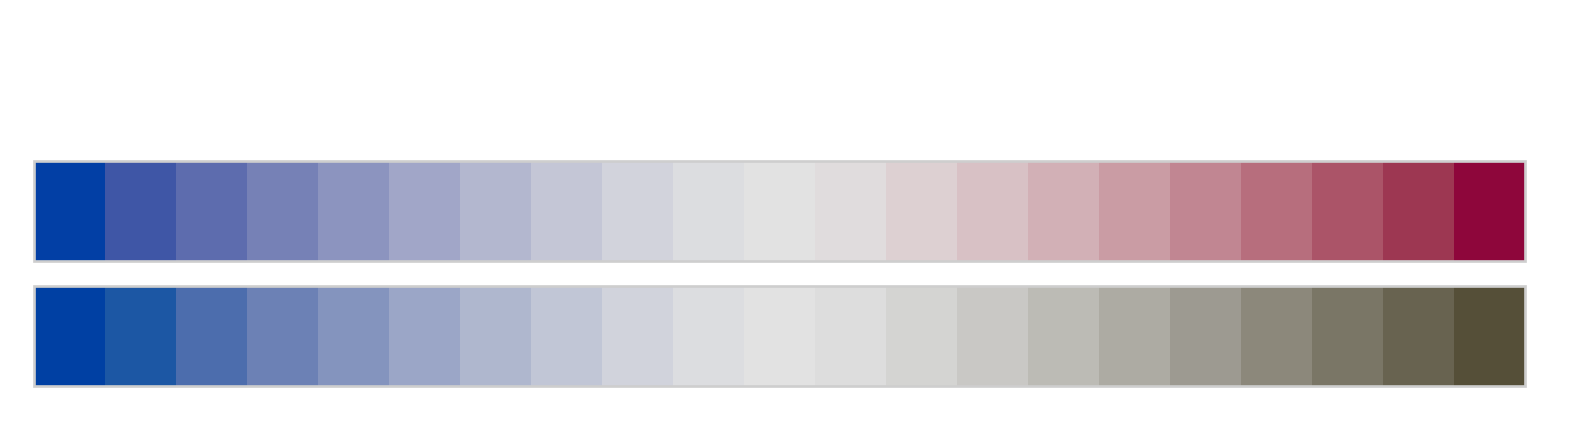

pal.swatchplot(n = 21, figsize = (8, 2),
               show_names = False,
               cvd = ["protan", "deutan", "tritan", "desaturate"])