# Create LinearSegmentedColormap from diverging_hcl() palette.
# By default, 256 distinct colors are used across the palette.
from colorspace import diverging_hcl, specplot
pal = diverging_hcl()
cmap1 = pal.cmap()
cmap1.N256Allows to retrieve a matplotlib LinearSegmentedColormap color map. Clasically LinearSegmentedColormaps allow to retrieve a set of N colors from a set of n colors where N >> n. The matplotlib simply linearely interpolates between all n colors to extend the number of colors to N.
In case of hclpalette objects this is not necessary as hclpalette objects allow to retrieve N colors directly along well-specified Hue-Chroma-Luminance paths. Thus, this method returns a matplotlib color map with n = N colors. The linear interpolation between the colors (as typically done by LinearSegmentedColormap) is not necessary. However, for convenience cmaps have been implemented such that you can easily use hcl based palettes in your existing workflow.
rainbow_hcl.cmap(n=256,
name='custom_hcl_cmap')nint
n = 256
namestr
custom_hcl_cmap
Returns a LinearSegmentedColormap (cmap) to be used with the matplotlib library.
# Create LinearSegmentedColormap from diverging_hcl() palette.
# By default, 256 distinct colors are used across the palette.
from colorspace import diverging_hcl, specplot
pal = diverging_hcl()
cmap1 = pal.cmap()
cmap1.N256# Same as above, but only using 5 distinct colors.
cmap2 = pal.cmap(n = 5)
cmap2.N5# Plotting HCL and sRGB spectrum for both cmaps
specplot(cmap1, rgb = True, figsize = (8, 6));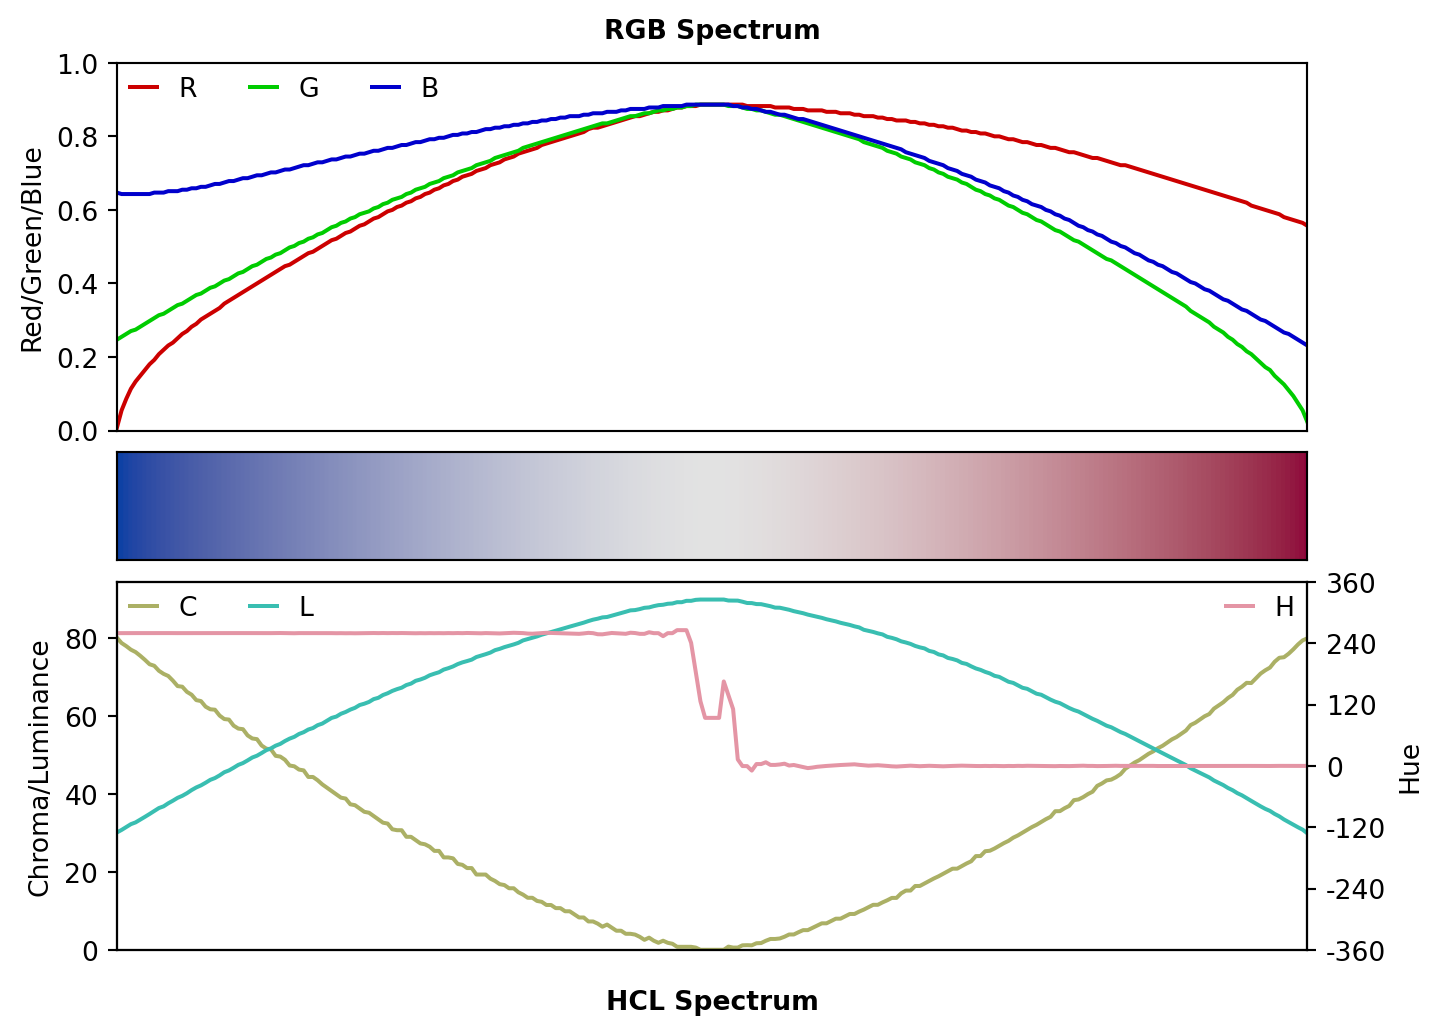
specplot(cmap2, rgb = True, figsize = (8, 6));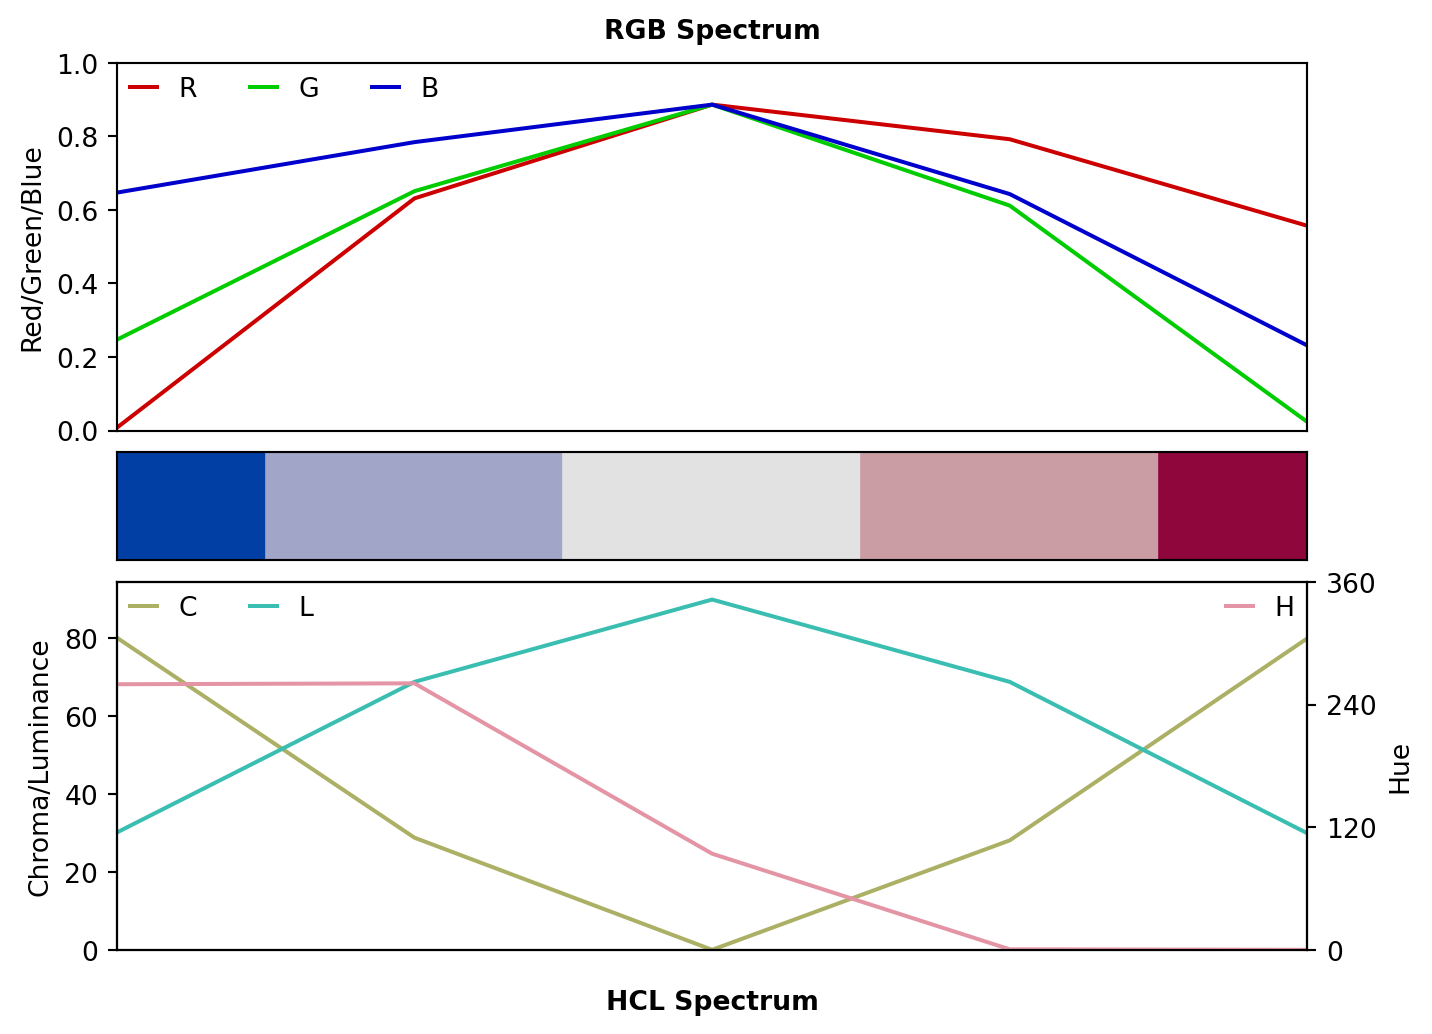
TypeError: If n is not int
ValueError: If n is lower than 2