from colorspace import diverging_hcl, palette, specplot
pal = diverging_hcl()
pal = palette(pal(5), name = "Diverging Palette with 5 Colors")
# Continuous colormap
cmap1 = pal.cmap(continuous = True)
cmap1.N # Internal number of colors256Converts the current palette into a matplotlib.colors.LinearSegmentedColormap color map based on the colors provided creating this palette object. If continuous = True a series of 256 unique colors will be created using linear interpolation in the standard RGB color space. If continuous = False the resulting color map is solely based on the number of colors of the palette which yields a non-continuous color map with step-functions in R, G, and B (see Example).
palette.cmap(continuous=True)continuousbool
True (default) the resulting colormap will contain 256 colors, linearely interpolated in between the colors of the palette. If False, only the N colors of the palette are used (see Examples).
from colorspace import diverging_hcl, palette, specplot
pal = diverging_hcl()
pal = palette(pal(5), name = "Diverging Palette with 5 Colors")
# Continuous colormap
cmap1 = pal.cmap(continuous = True)
cmap1.N # Internal number of colors256# Non-continuous version of the colormap
cmap2 = pal.cmap(continuous = False)
cmap2.N # Internal number of colors5# Using helper function for demonstration
specplot(cmap1, rgb = True, figsize = (8, 6));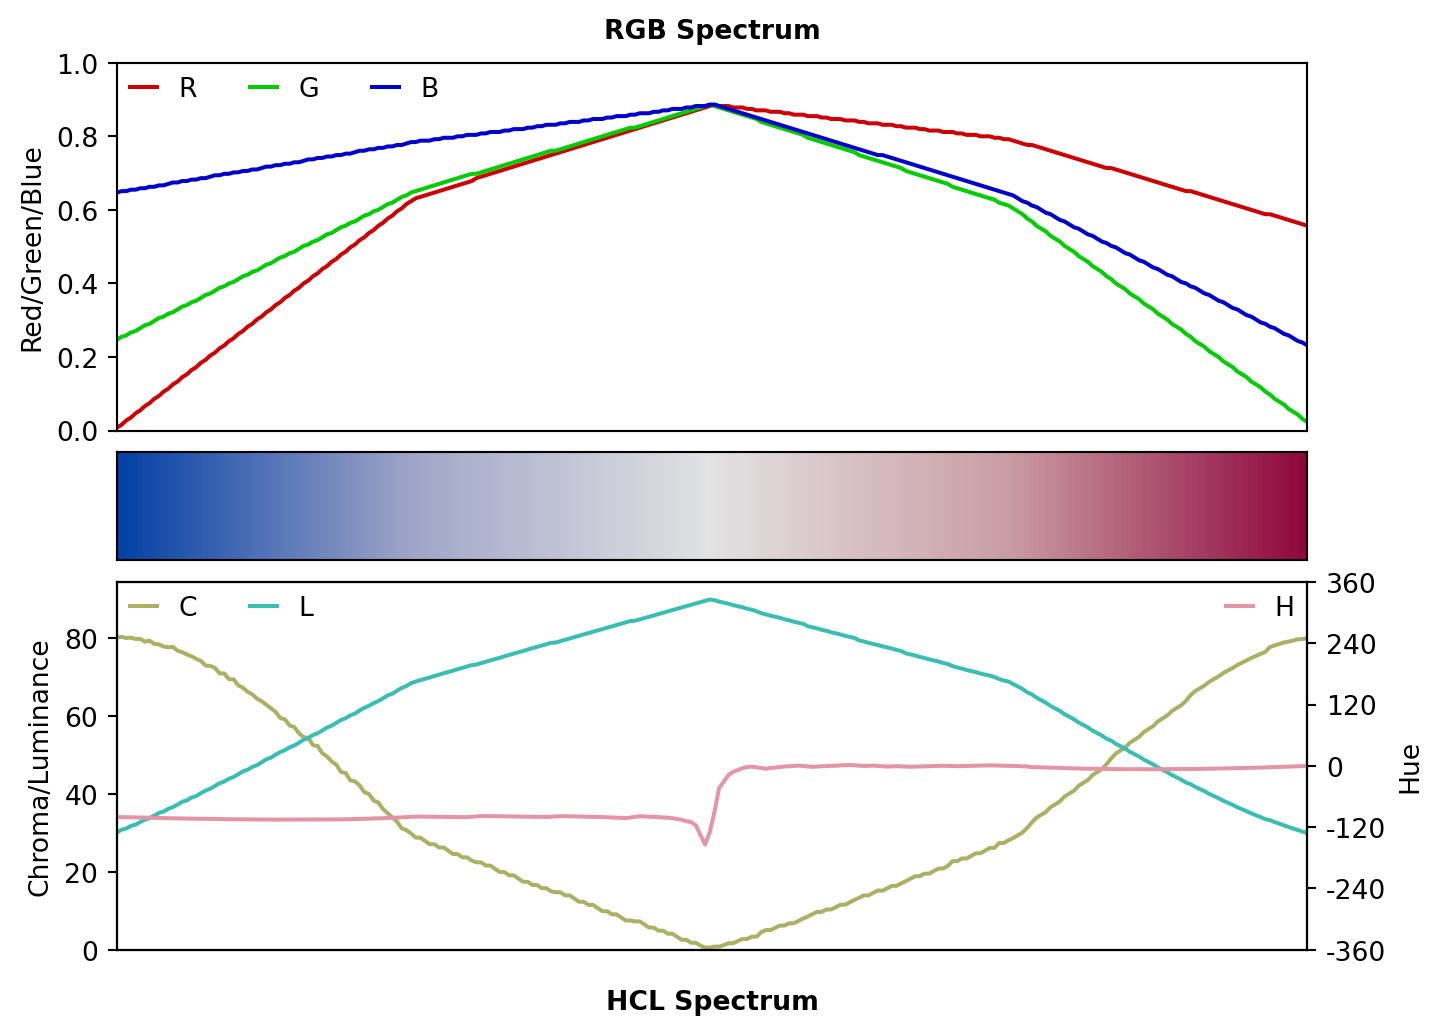
specplot(cmap2, rgb = True, figsize = (8, 6));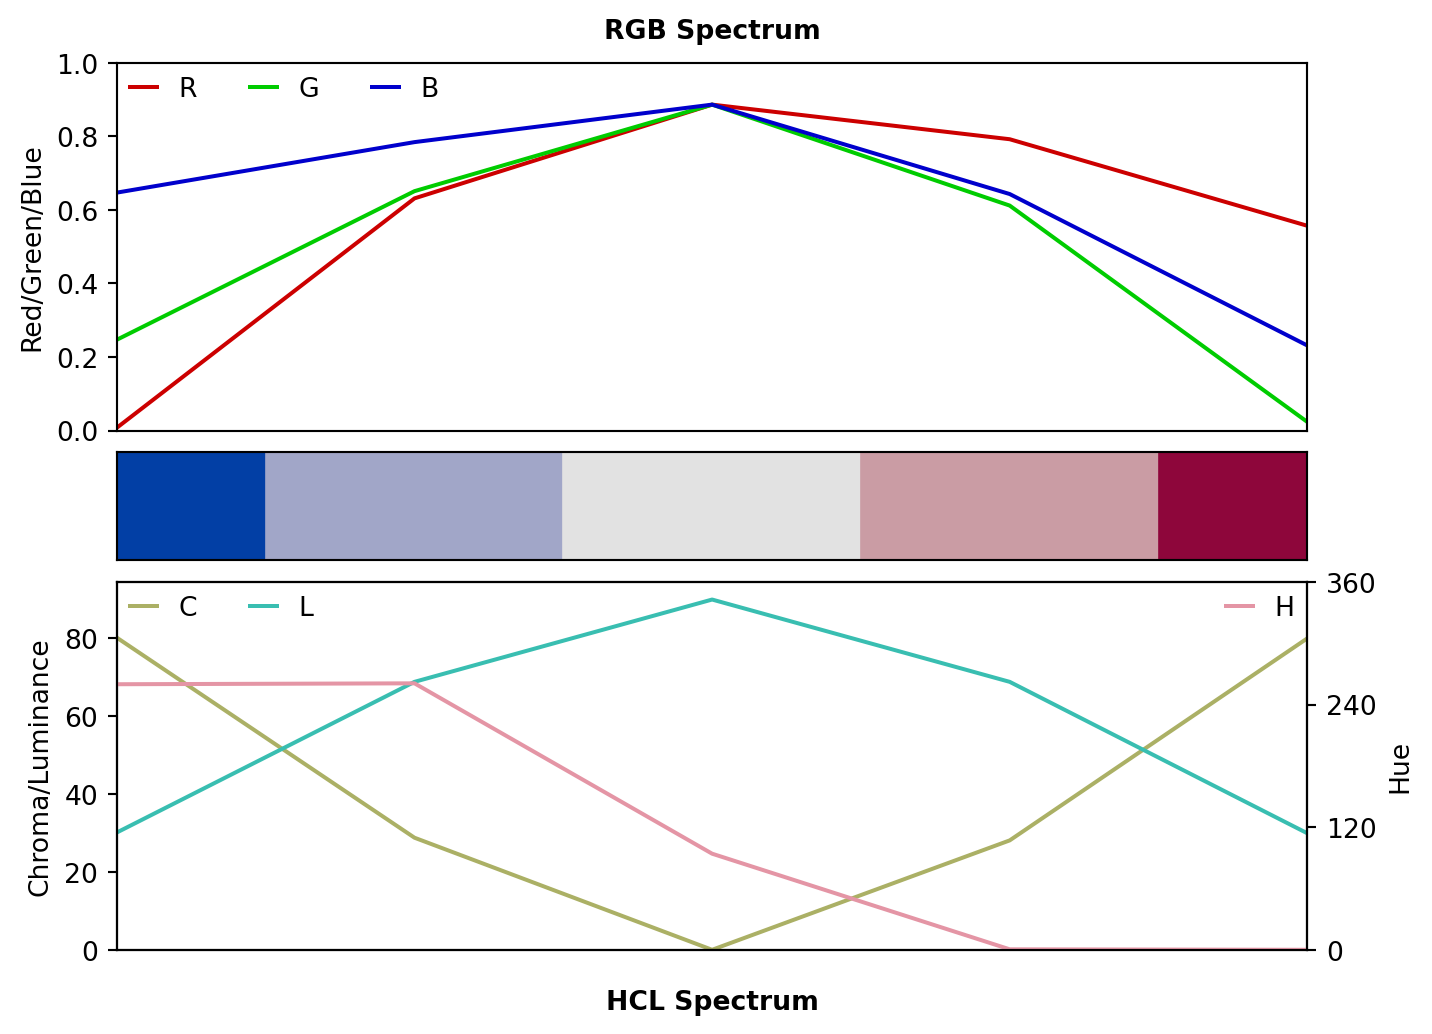
TypeError: If continuous is not bool