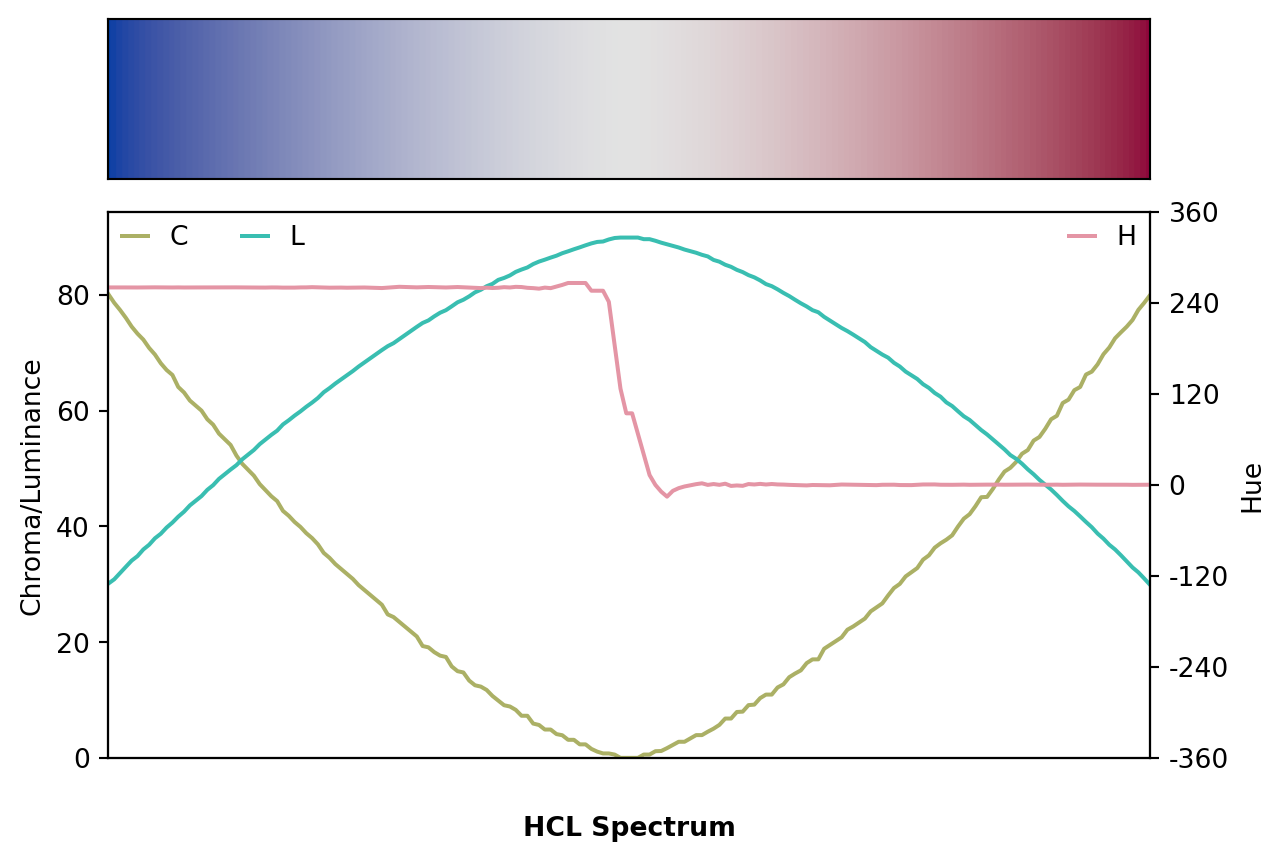
# Default diverging HCL palette
from colorspace import diverging_hcl
pal = diverging_hcl()
pal.specplot()
Interfacing the colorspace.specplot.specplot function. Plotting the spectrum of the current color palette.
heat_hcl.specplot(n=180, *args, **kwargs)nint
*args
**kwargs
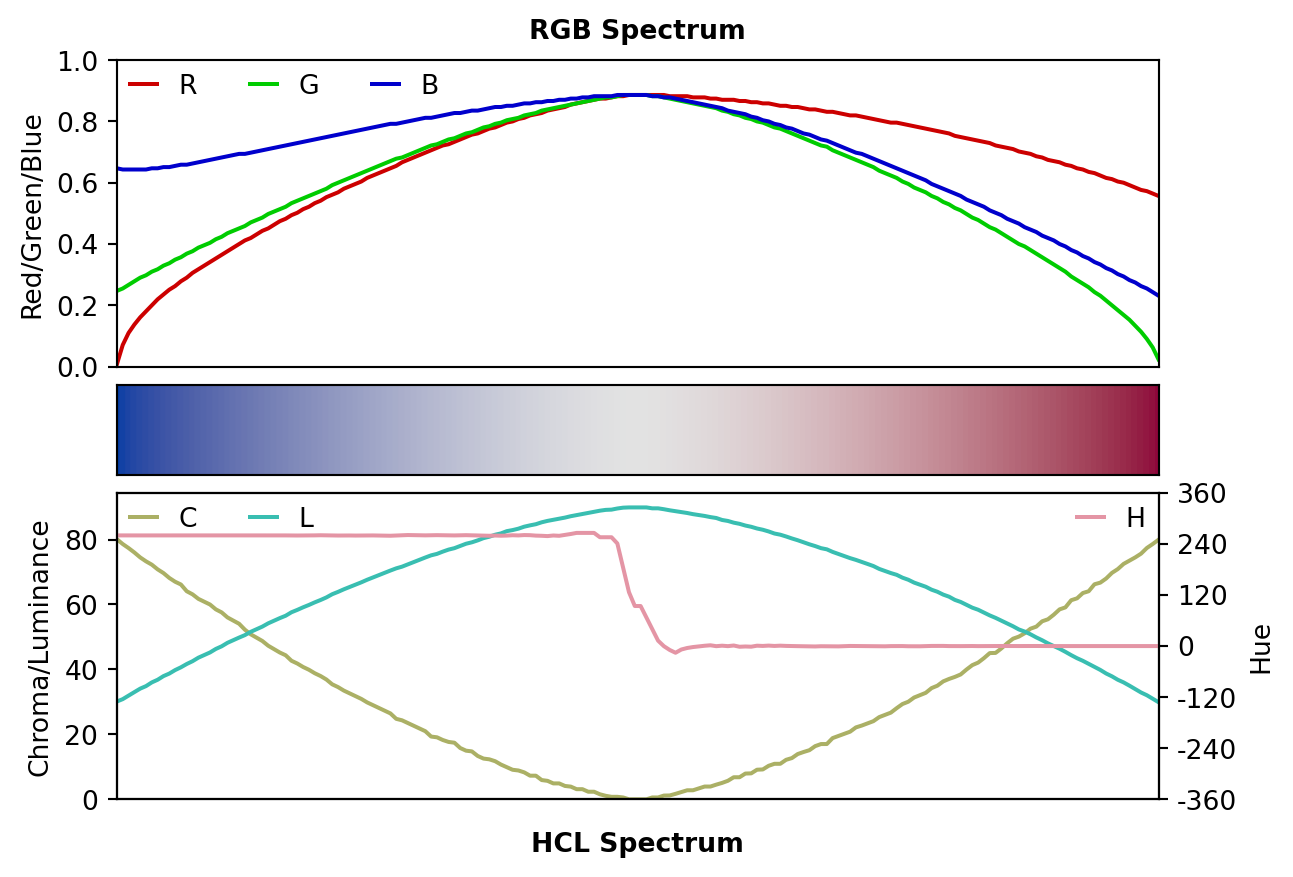
# Default diverging HCL palette
from colorspace import diverging_hcl
pal = diverging_hcl()
pal.specplot()
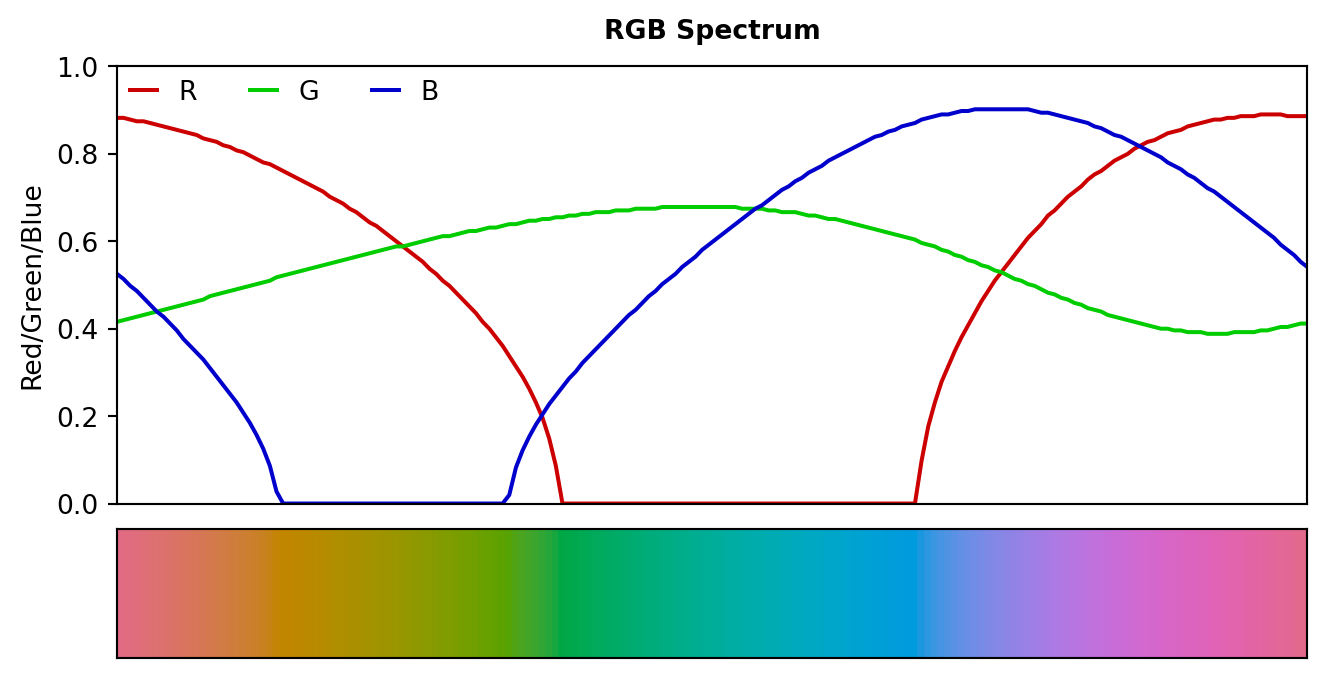
pal.specplot(rgb = True)
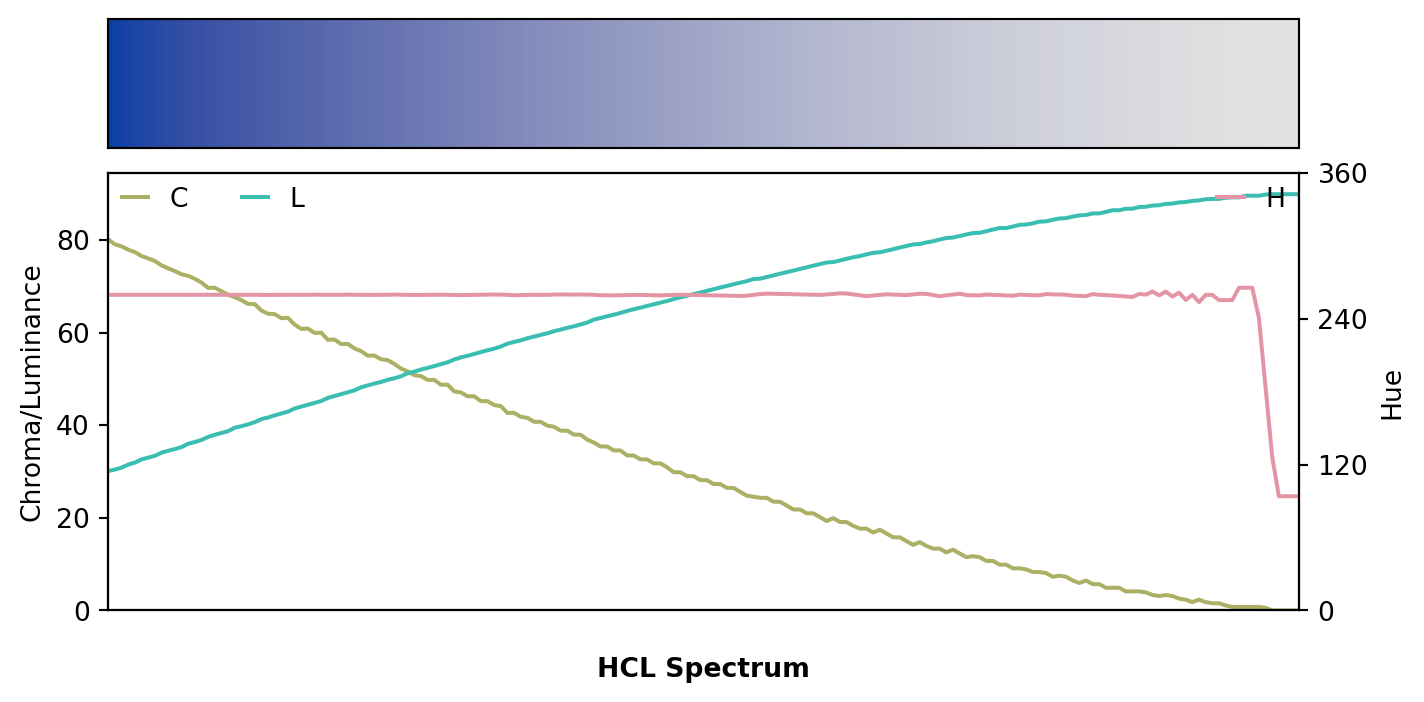
# Default sequential HCL palette
from colorspace import sequential_hcl
pal = sequential_hcl()
pal.specplot(figsize = (8, 4))
# Default qualitative HCL palette
from colorspace import qualitative_hcl
pal = qualitative_hcl()
pal.specplot(figsize = (8, 4), hcl = False, rgb = True)