# Example using HCL colors
from colorspace import HCL, hexcols
cols = HCL(H = [220, 196, 172, 148, 125],
           C = [ 44,  49,  55,  59,  50],
           L = [ 49,  61,  72,  82,  90])
cols.specplot(figsize = (8, 4));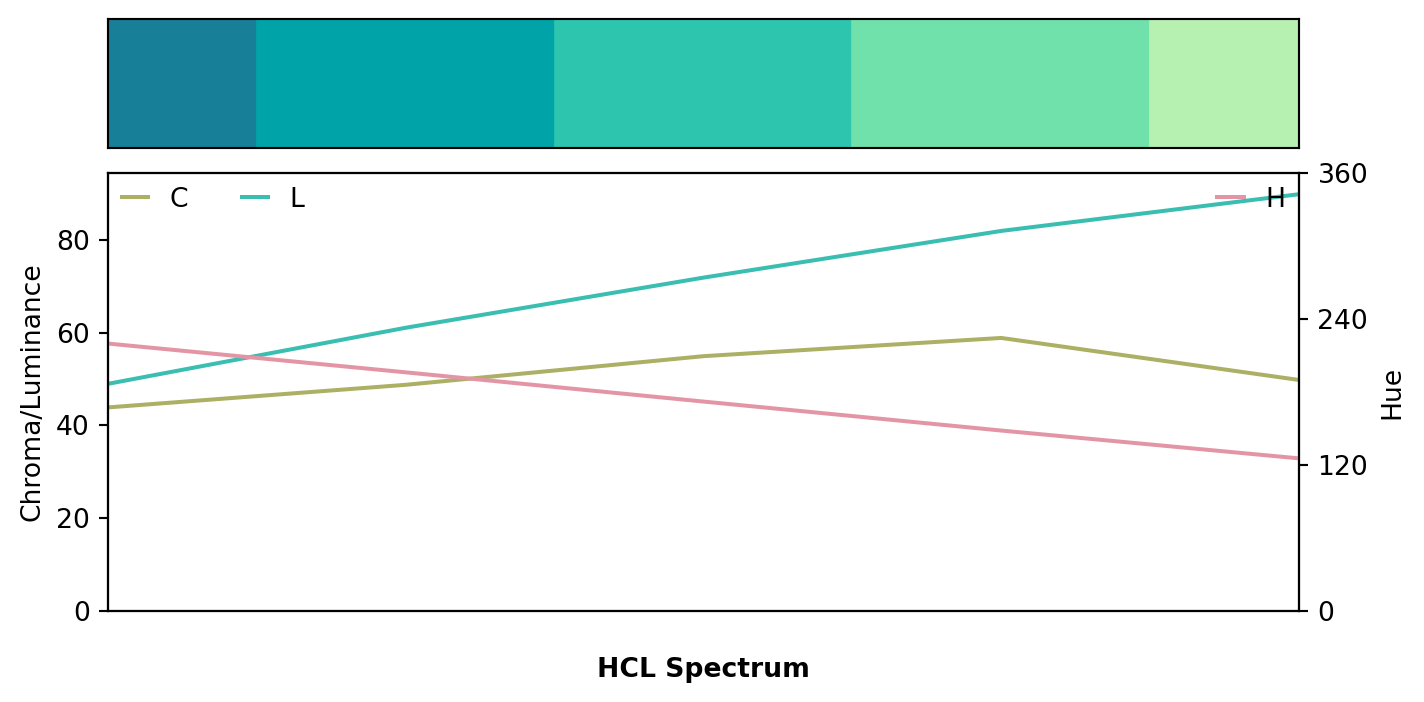
Visualization of the spectrum of this color object. Internally calls specplot, additional arguments to this main function can be forwarded via the **kwargs argument.
sRGB.specplot(**kwargs)**kwargs
# Example using HCL colors
from colorspace import HCL, hexcols
cols = HCL(H = [220, 196, 172, 148, 125],
C = [ 44, 49, 55, 59, 50],
L = [ 49, 61, 72, 82, 90])
cols.specplot(figsize = (8, 4));
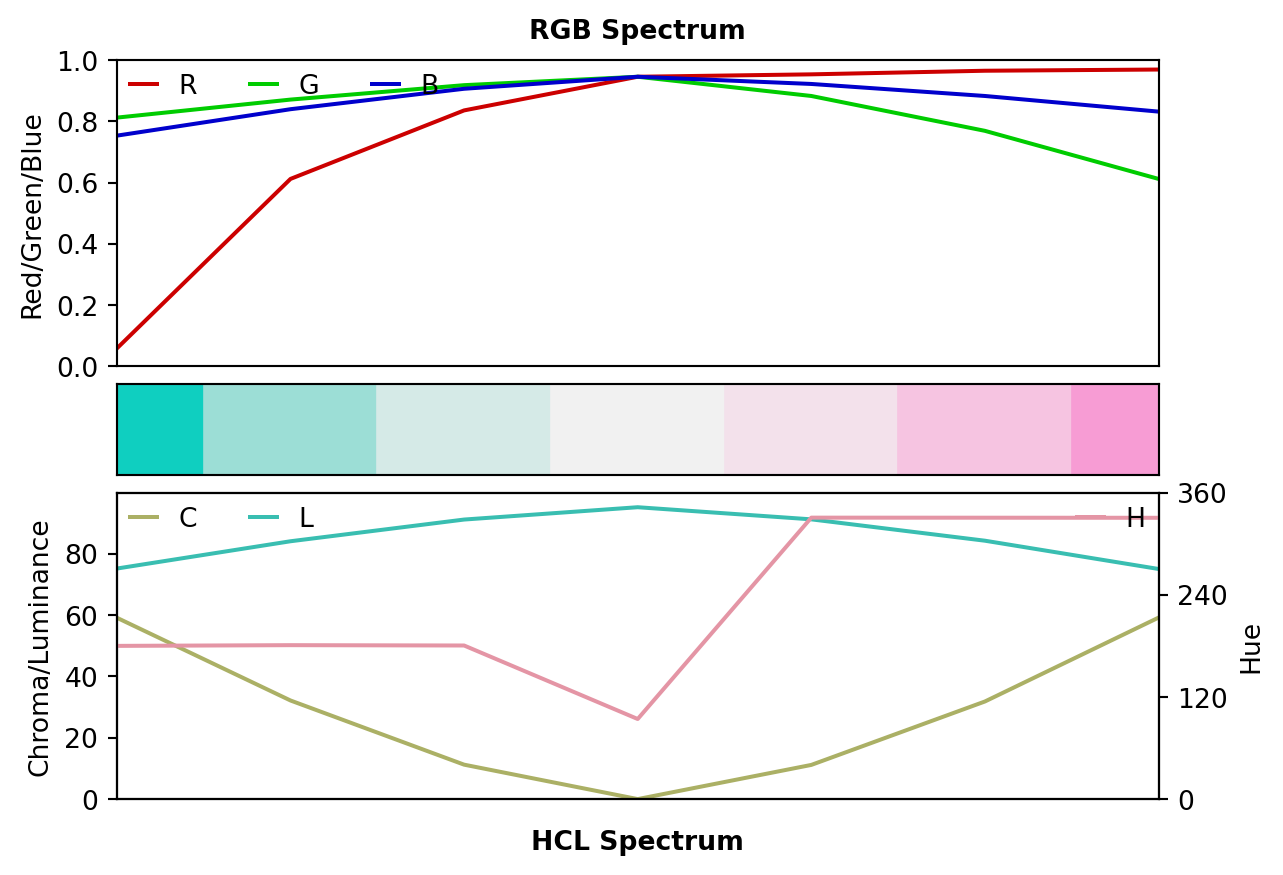
# Example using hex colors
cols = hexcols(["#0FCFC0", "#9CDED6", "#D5EAE7",
                "#F1F1F1", "#F3E1EB", "#F6C4E1", "#F79CD4"])
cols.specplot(rgb = True, hcl = True, palette = True)