Stationdata
Reto Stauffer
stationdata.RmdThis article contains a series of examples on how to retrieve station
observations for different data sets. There is a limit on how many data
can be retrieved via the API in one single call which is taken care by
the function gs_stationdata(). If the number of expected
data exceeds the limit, the function will automatically split thre
request in multiple calls. Some information about that is shown when the
argument verbose is set to TRUE
(FALSE by default).
More information about the data sets can be found on the Geosphere Austria data hub.
Hourly synop observations
Synop, 1 station, 3 parameters
- Dataset: historical hourly synop observations
- Ten consecutive days 2020
- Parameters: three parameters only
- Stations: single station,
11330Mayrhofen
mayrhofen <- gs_stationdata(mode        = "historical",
                            resource_id = "synop-v1-1h",
                            start       = "2022-01-01",
                            end         = "2022-01-11",
                            parameters  = c("T", "Td", "ff"),
                            station_ids = 11330)

# zoo object
head(mayrhofen)
## T Td ff
## 2022-01-01 00:00:00 -0.8 -1.4 1
## 2022-01-01 01:00:00 -0.7 -1.1 1
## 2022-01-01 02:00:00 -0.9 -1.5 0
## 2022-01-01 03:00:00 -1.5 -1.8 0
## 2022-01-01 04:00:00 -2.0 -2.3 0
## 2022-01-01 05:00:00 -2.2 -2.5 1
# simple zoo plot
plot(mayrhofen,
     screen = c(1, 1, 2),
     col    = c(2, 3, 4),
     ylab   = c("air temperature [C]\nwelt bulb temperature [C]",
                "mean wind speed [m/s]"))
As expert = TRUE (default) the function will internally
download the meta information calling gs_metadata() to
check if both arguments provided station_ids and
parameters are valid (i.e., the station and the parameters
are valid for this specific data set).
This can be disabled using expert = FALSE which prevents
these internal checks and save some time - but may result in API request
errors if the station(s) or parameter(s) do not exist.
One can, of course, get the meta information for the station and
parameters if needed (see gs_metdatata() for more
details):
meta <- gs_metadata(mode = "historical", resource_id = "synop-v1-1h")
subset(meta$stations, id == 11330)
## Simple feature collection with 1 feature and 8 fields
## Geometry type: POINT
## Dimension: XY
## Bounding box: xmin: 11.85167 ymin: 47.1625 xmax: 11.85167 ymax: 47.1625
## Geodetic CRS: WGS 84
## type id name state altitude valid_from valid_to is_active
## 1 INDIVIDUAL 11330 MAYRHOFEN Tirol 640 2007-08-28 2100-01-01 TRUE
## geometry
## 1 POINT (11.85167 47.1625)## name long_name
## 39 T Lufttemperatur
## 40 Td Taupunkttemperatur
## 57 ff Windgeschwindigkeit
## desc unit
## 39 Lufttemperatur °C
## 40 Taupunkt (bis 2001/06/19 tw. mit rel beschickt!) °C
## 57 Windgeschwindigkeit in 1/10 m/s (wird umgerechnet, wenn Knoten: *5.14) m/sSynop, multiple stations, all parameters
- Dataset: historical hourly synop observations
- Ten consecutive days 2020
- Parameters: all available parameters (uses
parameters = NULL; default) - Stations: three different stations
The function allows to retrieve data for multiple stations at once
and to download all avialable parameters by not specifying
parameters (uses parameters = NULL). This will
return all avialable data for each of the stations in a named list,
where the names of the elements correspond to the station
id.
x <- gs_stationdata(mode        = "historical",
                    resource_id = "synop-v1-1h",
                    start       = "2020-01-01",
                    end         = "2020-01-11",
                    station_ids = c(11330, 11328, 11120),
                    expert      = TRUE)
class(x)
## [1] "list"
names(x)## [1] "11330" "11328" "11120"expert = TRUE skips the internal check whether or not
the station_ids given are valid (i.e., if they even exist
for this data set).
Note that station 11328 does not provide any data for
the time period specified resulting in a warning and an will return a
missing value (NA).
x[["11328"]]## GeoSphere Austria stationdata
## Station ID: 11328
## Coordinates: 11.70528 47.53222
## Parameters:
## C1 Wolkenart der tiefsten Wolkenschicht (Code (Synop))
## C2 Wolkenart der 2.tiefsten Wolkenschicht (Code (Synop))
## C3 Wolkenart der 3.tiefsten Wolkenschicht (Code (Synop))
## C4 Wolkenart der 4.tiefsten Wolkenschicht (Code (Synop))
## CH Art der hohen Wolken (Code (Synop))
## CL Art der tiefen Wolken (Code (Synop))
## CM Art der mittelhohen Wolken (Code (Synop))
## Ch1 1.Wolkenart unterhalb der Station (Code (Synop))
## Ch2 2.Wolkenart unterhalb der Station (Code (Synop))
## Ch3 3.Wolkenart unterhalb der Station (Code (Synop))
## Ct1 1.Aussehen der Wolkenobergrenze der Wolken unterhalb der Station (Code (Synop))
## Ct2 2.Aussehen der Wolkenobergrenze der Wolken unterhalb der Station (Code (Synop))
## Ct3 3.Aussehen der Wolkenobergrenze der Wolken unterhalb der Station (Code (Synop))
## Da Richtungsangabe der Wirbelerscheinung (Code (Synop))
## E Erdbodenzustand ohne Schnee/Eis (Code (Synop))
## Eschnee Erdbodenzustand mit Schneedecke/Eis (Code (Synop))
## Ir Niederschlagsindikator (Code (Synop))
## Iw Einheit der Windgeschwindigkeit (Code (Synop))
## Ix Indikator für Wettergruppen und Stationstyp (Code (Synop))
## Mw Art der Wirbelerscheinung (Code (Synop))
## N Gesamtbedeckung des Himmels mit Wolken (Code (Synop))
## Nh Bedeckungsgrad mit tiefen oder mittelhohen Wolken (Code (Synop))
## Nh1 1.Bedeckungsgrad mit Wolken unter der Station (Code (Synop))
## Nh2 2.Bedeckungsgrad mit Wolken unter der Station (Code (Synop))
## Nh3 3.Bedeckungsgrad mit Wolken unter der Station (Code (Synop))
## Ns1 Bedeckungsgrad der tiefsten Wolkenschicht (Code (Synop))
## Ns2 Bedeckungsgrad der 2.tiefesten Wolkenschicht (Code (Synop))
## Ns3 Bedeckungsgrad der 3.tiefesten Wolkenschicht (Code (Synop))
## Ns4 Bedeckungsgrad der 4.tiefesten Wolkenschicht (Code (Synop))
## Pg Luftdruck (hPa)
## Pp Reduzierter Luftdruck (hPa)
## RR24 Niederschlagsmenge in den 24 Stunden vor der Beobachtung (mm)
## RR3 Niederschlagsmenge Sektion3 (mm)
## RR932 Hagelkorndurchmesser (Code (Synop))
## RR934 Glatteisdicke (Code (Synop))
## RRR Niederschlagsmenge im Beobachtungszeitraum tr (mm)
## RRRv Niederschlagsmenge des Vortages (mm)
## So Reif oder färbiger Niederschlag (Code (Synop))
## T Lufttemperatur (°C)
## Td Taupunkttemperatur (°C)
## Tg Minimum der Lufttemperatur 5cm über Boden (°C)
## Tmax Maximum der Lufttemperatur (°C)
## Tmaxv Maximum der Lufttemperatur des Vortags (°C)
## Tmin Minimum der Lufttemperatur (°C)
## Tw Wassertemperatur (°C)
## VV Sichtweite (Code (Synop))
## W1 1.Wetterverlauf (Code (Synop))
## W2 2.Wetterverlauf (Code (Synop))
## a Luftdrucktendenz (3 Stunden) (Code (Synop))
## app24 Luftdrucktendenz (24 Stunden) (Code (Synop))
## boe Höchste Bö (10 Minuten) (m/s)
## czeit Beobachtungszeit ()
## datumsec Beobachtungszeit (s)
## dd Windrichtung (°)
## einspielzeit Einspielzeit in die Datenbank (s)
## ff Windgeschwindigkeit (m/s)
## flag_rst Flag Reststring (Code)
## gruen Korrekturflag (Code)
## h Höhe der tiefsten Wolken (Code (Synop))
## hh1 1.Obergrenze der Wolken unter der Station (m)
## hh2 2.Obergrenze der Wolken unter der Station (m)
## hh3 3.Obergrenze der Wolken unter der Station (m)
## hs1 Wolkenhöhe der tiefsten Wolkenschicht (Code (Synop))
## hs2 Wolkenhöhe der 2.tiefsten Wolkenschicht (Code (Synop))
## hs3 Wolkenhöhe der 3.tiefsten Wolkenschicht (Code (Synop))
## hs4 Wolkenhöhe der 4.tiefsten Wolkenschicht (Code (Synop))
## io Intenstität von Reif oder färbigem Niederschlag (Code (Synop))
## nschnee Neuschneehöhe (Code (Synop))
## p Betrag der Luftdruckänderung (hPa)
## qflag Qualitätsflag ()
## rel Relative Feuchte (%)
## rot Korrekturflag (Code)
## schnee Gesamtschneehöhe (Code (Synop))
## schwarz Korrekturflag (Code)
## sonne Sonnenscheindauer der letzten Stunde (h)
## sonnetag Sonnenscheindauer des Vortags (h)
## sp1 Besondere Wettererscheinungen, 1. 9er Gruppe (Code (Synop))
## sp10 Besondere Wettererscheinungen, 10. 9er Gruppe (Code (Synop))
## sp11 Besondere Wettererscheinungen, 11. 9er Gruppe (Code (Synop))
## sp12 Besondere Wettererscheinungen, 12. 9er Gruppe (Code (Synop))
## sp13 Besondere Wettererscheinungen, 13. 9er Gruppe (Code (Synop))
## sp14 Besondere Wettererscheinungen, 14. 9er Gruppe (Code (Synop))
## sp15 Besondere Wettererscheinungen, 15. 9er Gruppe (Code (Synop))
## sp2 Besondere Wettererscheinungen, 2. 9er Gruppe (Code (Synop))
## sp3 Besondere Wettererscheinungen, 3. 9er Gruppe (Code (Synop))
## sp4 Besondere Wettererscheinungen, 4. 9er Gruppe (Code (Synop))
## sp5 Besondere Wettererscheinungen, 5. 9er Gruppe (Code (Synop))
## sp6 Besondere Wettererscheinungen, 6. 9er Gruppe (Code (Synop))
## sp7 Besondere Wettererscheinungen, 7. 9er Gruppe (Code (Synop))
## sp8 Besondere Wettererscheinungen, 8. 9er Gruppe (Code (Synop))
## sp9 Besondere Wettererscheinungen, 9. 9er Gruppe (Code (Synop))
## tr Beobachtungszeitraum für Niederschlagsmenge (Code (Synop))
## tr3 Beobachtungszeitraum für Niederschlagsmenge RR3, Sektion 3 (Code (Synop))
## w1boe Höchste Bö (W1W2) (m/s)
## w1ffmax Höchste mittlere Windgeschwindigkeit (W1W2) (m/s)
## ww Wetter zur Beobachtungszeit (Code (Synop))
## ww960 Erweiterter Wetterzustand: gleichzeitig mit ww (Code (Synop))
## ww961 Erweiterter Wetterzustand: gleichzeitig mit w1w1 (Code (Synop))
## ww962 Erweiterter Wetterzustand: in der letzten Stunde, bei ww=20-29 (Code (Synop))
## ww963 Erweiterter Wetterzustand: in der letzten Stunde, bei w1w1=20-29 (Code (Synop))
## ww964 Erweiterter Wetterzustand: im Bezugszeitraum von W1W2 bei ww (Code (Synop))
## ww965 Erweiterter Wetterzustand: im Bezugszeitraum von W1W2 bei w1w1 (Code (Synop))
##
## Data:
## numeric(0)
##
## Index:
## Date of length 0
is.na(x[["11328"]])## logical(0)The other two elements of the list again contain objects of class c(“gs_stationdata”, “zoo”):
## $`11330`
## [1] "gs_stationdata" "zoo"
##
## $`11120`
## [1] "gs_stationdata" "zoo"## $`11330`
## Ir Iw Ix Pg Pp RR3 RRR T Td Tg Tmax Tmin W1 W2
## 2020-01-01 00:00:00 3 1 6 958.0 1037.5 NA -1 -1.1 -1.8 NA NA NA NA NA
## 2020-01-01 01:00:00 3 1 6 958.1 1037.7 NA -1 -1.3 -2.0 NA NA NA NA NA
## a datumsec dd einspielzeit ff flag_rst gruen p qflag
## 2020-01-01 00:00:00 8 1577836800 NA 1577836916 1 0 0 0.7 0
## 2020-01-01 01:00:00 5 1577840400 0 1577840534 0 0 0 1.1 0
## rot schwarz sonne tr tr3 ww
## 2020-01-01 00:00:00 0 0 NA 1 NA NA
## 2020-01-01 01:00:00 0 0 NA NA NA NA
##
## $`11120`
## C1 C2 Ir Iw Ix N Ns1 Ns2 Ns3 Pg Pp RR3 RRR T Td
## 2020-01-01 00:00:00 NA NA 3 1 4 3 3 NA NA 964.0 1038.4 NA -1 -3.4 -4.0
## 2020-01-01 01:00:00 NA NA 3 1 4 6 1 6 NA 963.8 1038.1 NA -1 -3.0 -3.4
## Tg Tmax Tmin VV a boe datumsec dd einspielzeit ff
## 2020-01-01 00:00:00 NA NA NA 5 4 NA 1577836800 NA 1577836219 1
## 2020-01-01 01:00:00 NA NA NA 5 5 NA 1577840400 NA 1577839821 1
## flag_rst gruen h hs1 hs2 hs3 p qflag rot schwarz sonnetag
## 2020-01-01 00:00:00 0 0 2 5 NA NA 0.0 0 0 0 5.1
## 2020-01-01 01:00:00 0 0 1 1 4 NA 0.6 0 0 0 NA
## sp1 sp2 sp3 tr tr3 w1boe w1ffmax ww
## 2020-01-01 00:00:00 NA NA NA NA NA NA NA 49
## 2020-01-01 01:00:00 NA NA NA NA NA NA NA 49The API, however, provides different data for the other two stations as these two stations do not provide the data for the very same parameters. Parameters not providing any data will not be included in the return.
## $`11330`
## [1] 241  29
##
## $`11120`
## [1] 241  44
# Default plots
plot(x[["11330"]], nc = 3, col = "steelblue", type = "o", pch = 4)
plot(x[["11120"]], nc = 3, col = "steelblue", type = "o", pch = 4)
TAWES data
TAWES stands for “teilautomatische Wetterstation” and provides data on a 10 minute temporal resolution. Requesting data for TAWES stations works the very same way as for synop stations as shown above, however, the set of avialble stations and parameters is different (names of the parameters differ).
To get information about all available stations and parameters call:
meta <- gs_metadata("historical", "tawes-v1-10min")… and check the vignette Metadata for more information on the return.
Klima
Daily climate records, 1 station, 3 parameters
- Dataset: historical climate recoreds; daily temporal resolution
- Summer 2020 till the end of 2022 (2.5 years)
- Parameters: three distinct parameters (precipitation and snow height)
- Stations: single station,
8807Achenkirch
meta <- gs_metadata("historical", "klima-v1-1d")
achenkirch <- gs_stationdata(mode        = "historical",
                             resource_id = "klima-v1-1d",
                             start       = "2020-06-01",
                             end         = "2022-12-31",
                             parameters  = c("nied", "nied07", "schnee"),
                             station_ids = 8807,
                             expert      = TRUE)
head(achenkirch)
## nied nied07 schnee
## 2020-06-01 -1.0 NA -1
## 2020-06-02 -1.0 -1.0 -1
## 2020-06-03 4.2 -1.0 -1
## 2020-06-04 8.2 4.2 -1
## 2020-06-05 0.1 8.2 -1
## 2020-06-06 6.7 0.1 -1
plot(achenkirch, type = "h")
10min climate records, 1 station, 3 parameters
- Dataset: historical climate recoreds; daily temporal resolution
- Summer 2020 till the end of 2022 (2.5 years)
- Parameters: three distinct parameters (precipitation and snow height)
- Stations: single station,
8807Achenkirch
meta <- gs_metadata("historical", "klima-v1-10min")
uibk <- gs_stationdata(mode        = "historical",
                       resource_id = "klima-v1-10min",
                       start       = "2010-11-01",
                       end         = "2011-02-01",
                       parameters  = c("TL", "FFAM", "FFX"),
                       station_ids = 11803,
                       verbose     = TRUE,
                       expert      = TRUE)
## Estimated number of elements to be retrieved: 52996 (1 x 4 x 13249)## Number of requests to be performed: 1 (limit set to 2e+05)## Cooldown, waiting for 0.912 seconds## Calling: https://dataset.api.hub.geosphere.at/v1/station/historical/klima-v1-10min?parameters=TL,FFAM,FFX&start=2010-11-01T00:00&end=2011-02-01T00:00&station_ids=11803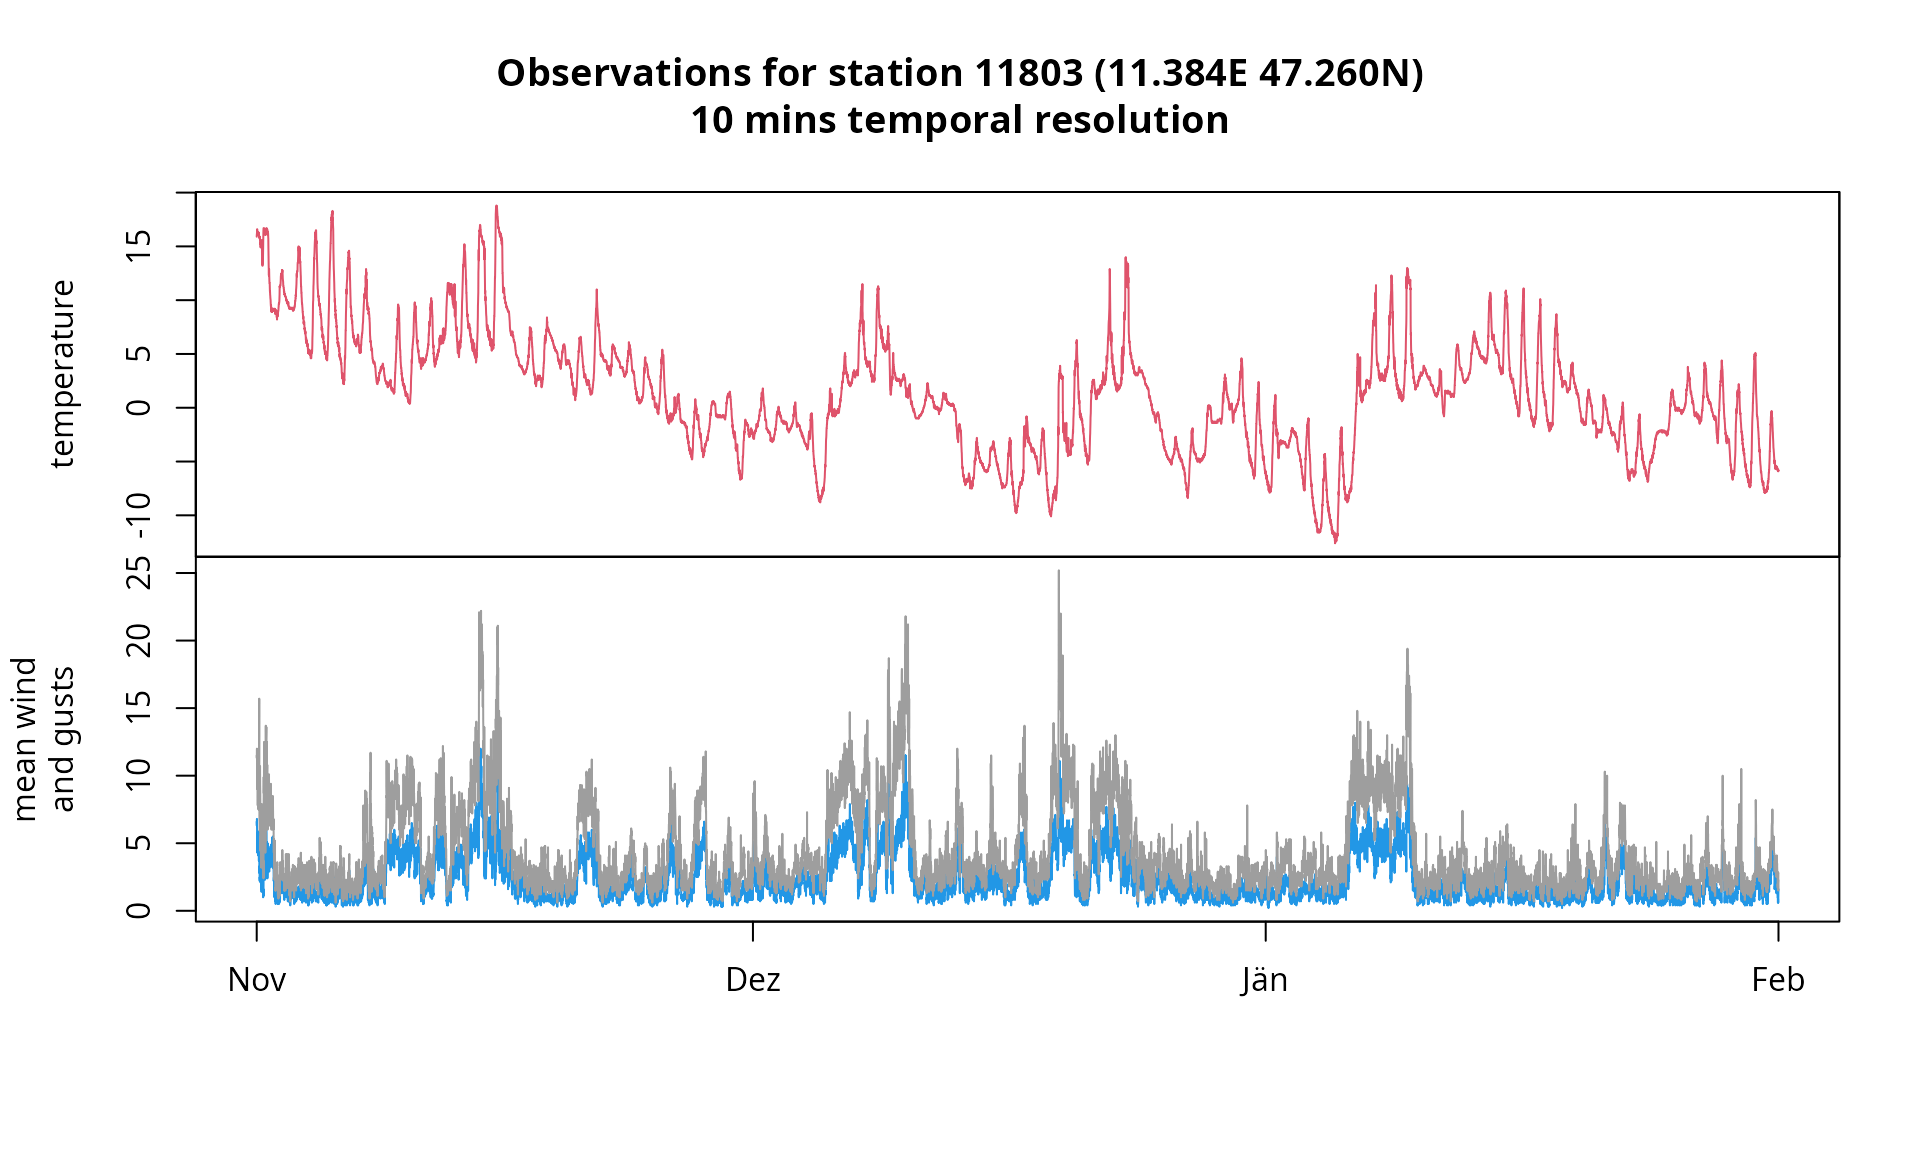
TAWES, 1 station, 4
- Dataset: historical TAWES observations, 10min temporal resolution
- Past 30 consecutive days (based on system date)
- Parameters: four predefined parameters
- Stations: single station,
11121Innsbruck Airport
WARNING: resource_id = "tawes-v1-10min"
is not qualiy controlled and seems to provide a limited amount of data
(not going too far back in time). Consider using
resource_id = "klima-v1-10min" instead (see above) which
provides long-term historical quality-controlled data. Station IDs (and
available parameters) differ, tough.
ibkap <-  gs_stationdata(mode        = "historical",
                         resource_id = "tawes-v1-10min",
                         start       = Sys.Date() - 30,    # Today - 30 days (system time)
                         end         = Sys.Date(),         # Today (system time)
                         parameters  = c("TL", "TP", "FFAM", "FFX"),
                         station_ids = 11121,
                         expert      = TRUE)
plot(ibkap,
     screens = c(1, 1, 2, 2),
     col = c(2, 3, 4, 8),
     ylab = c("temperature\nand dewpoint", "mean wind\nand gusts"))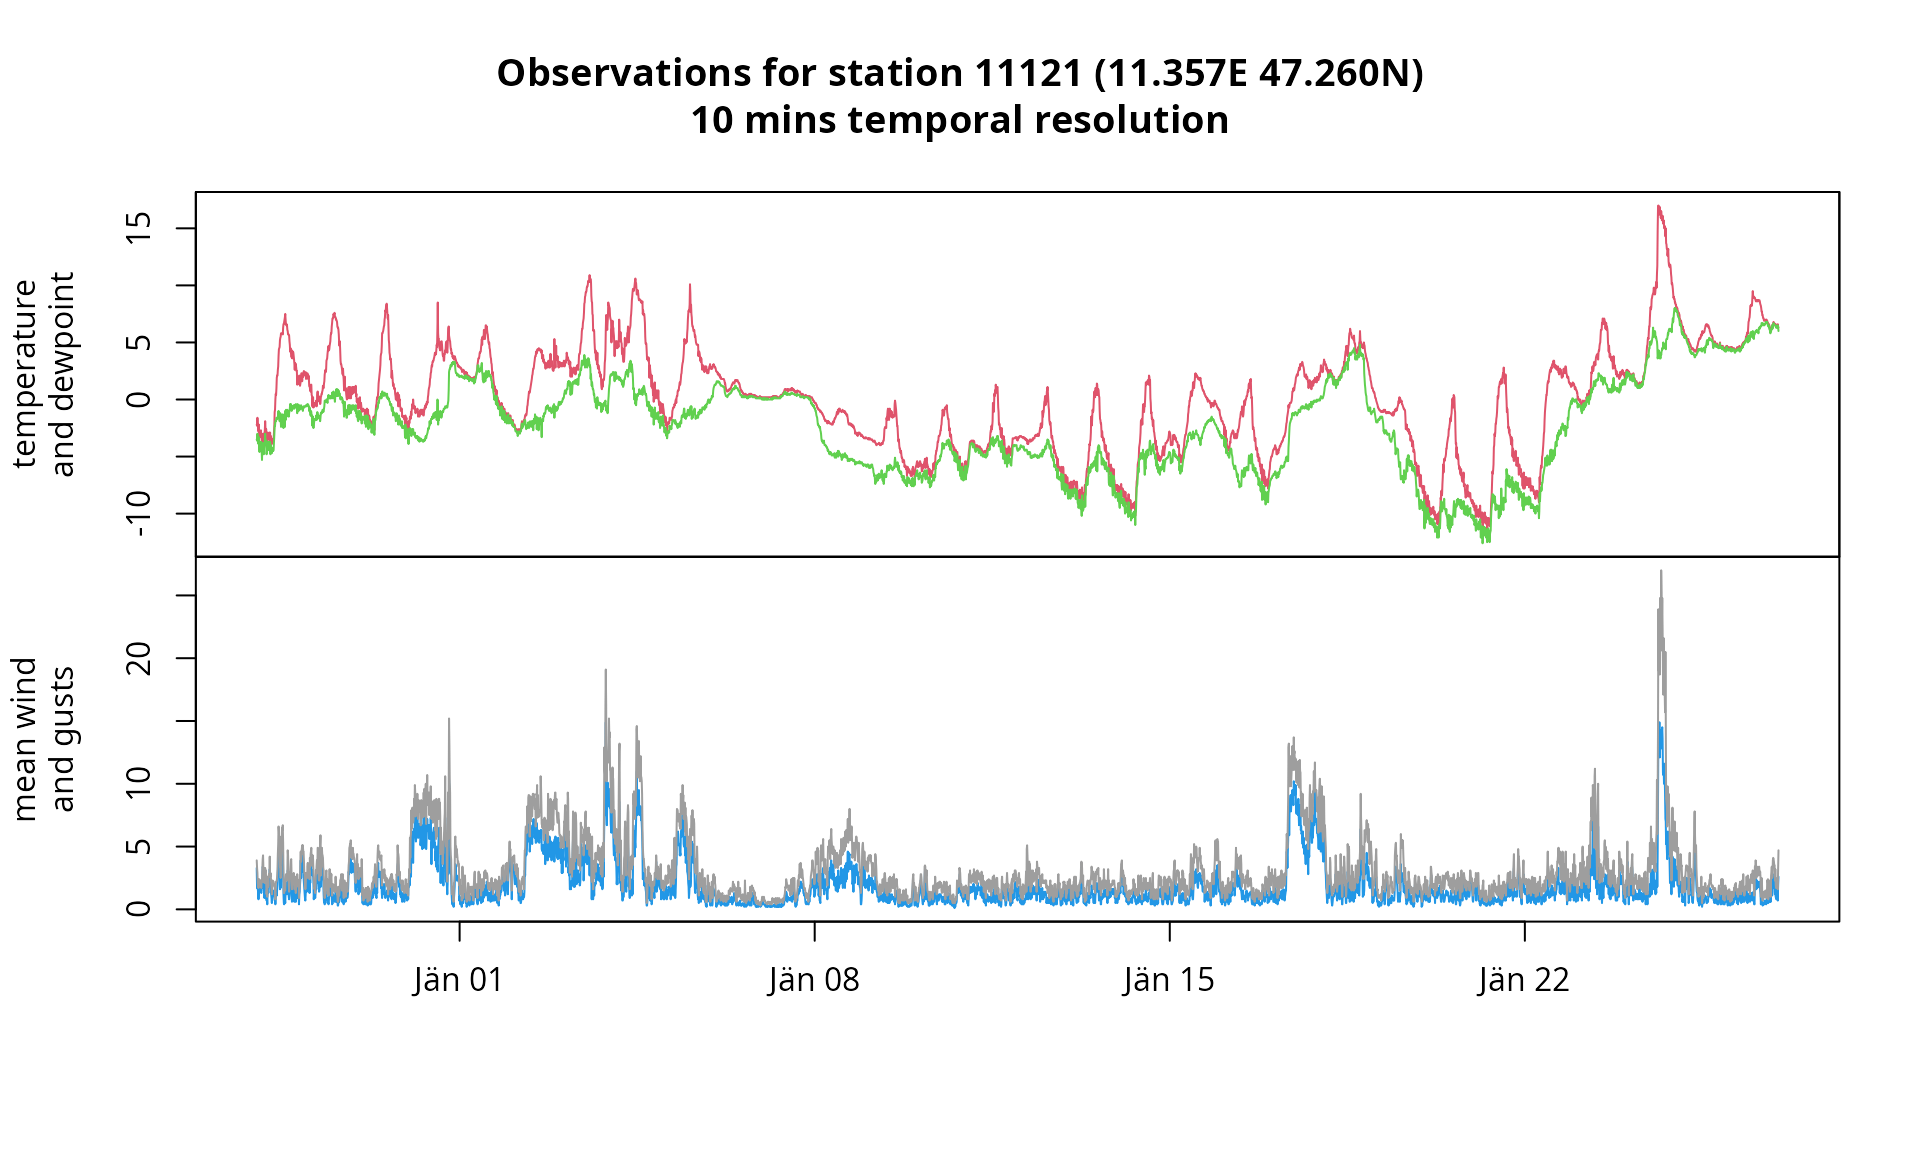
Histalp
Histalp annual data, 1 station, 2 parameters
- Dataset: historical histalp records; annual observations
- 1845 to 2022
- Parameters: precipitation and temperature (annual)
- Stations: single station,
23Bregenz
NOTE: Not executed; requires login; currently throws an error.
meta <- gs_metadata("historical", "histalp-v1-1y")
bregenz <- gs_stationdata(mode        = "historical",
                          resource_id = "histalp-v1-1y",
                          start       = "1854-01-01",
                          end         = "2022-01-01",
                          parameters  = c("R01", "T01"),
                          station_ids = 23,
                          expert      = TRUE)
## ---## Error in `show_http_status_and_terminate()`:
## ! HTTP request error
## status returned by API:
## details: Internal server error
## http_status description:
## category: Server error
## reason: Internal Server Error
## message: Server error: (500) Internal Server Error
##plot(bregenz, col = c(4, 2))