vignettes/windrose.Rmd
windrose.RmdWindrose
The foehnix package comes with methods to create
windrose plot for foehn classification models (see getting started, foehnix reference)
and observation data. Two types of windrose plots are available:
- density: empirical density
- histogram: empirical circular histogram
Windrose Plot for Observation Data
The windrose
function allows to plot empirical circular densities and histograms (the
classical ‘windrose’) of observed values. The data set can either be
a
- multivariate
zootime series object, - a
data.frame, - or simply two numeric vectors.
All needed is wind speed () and wind direction. The wind direction needs to be provided in meteorological degrees () where and corresponds to wind coming from North, for wind from East, for wind from South, and from West.
If used with a multivariate zoo object or a
data.frame the windrose function
expects to find two variables called ff (wind speed) and
dd (wind direction). However, custom names can be specified
if needed (see customization section). The plot below shows examples
using zoo, data.frame, or numeric
vectors. While the upper two show type = "density", the
lower two show the circular histograms
(type = "histogram").
##                      dd  ff  rh    t
## 2006-01-01 01:00:00 171 0.6  90 -0.4
## 2006-01-01 02:00:00 268 0.3 100 -1.8
## 2006-01-01 03:00:00 115 5.2  79  0.9
## 2006-01-01 04:00:00 152 2.1  88 -0.6
## 2006-01-01 05:00:00 319 0.7 100 -2.6
## 2006-01-01 06:00:00  36 0.1  99 -1.7
class(data)## [1] "zoo"
# Default plot using a zoo object
par(mfrow = c(2, 2), mar = c(1, 1, 3, 1))
windrose(data)
# Default plot using a data.frame
windrose(data.frame(data))
# Defualt plot using univariate zoo objects/numeric vectors
windrose(data$dd, data$ff, type = "histogram")
windrose(as.numeric(data$dd), as.numeric(data$ff), type = "histogram")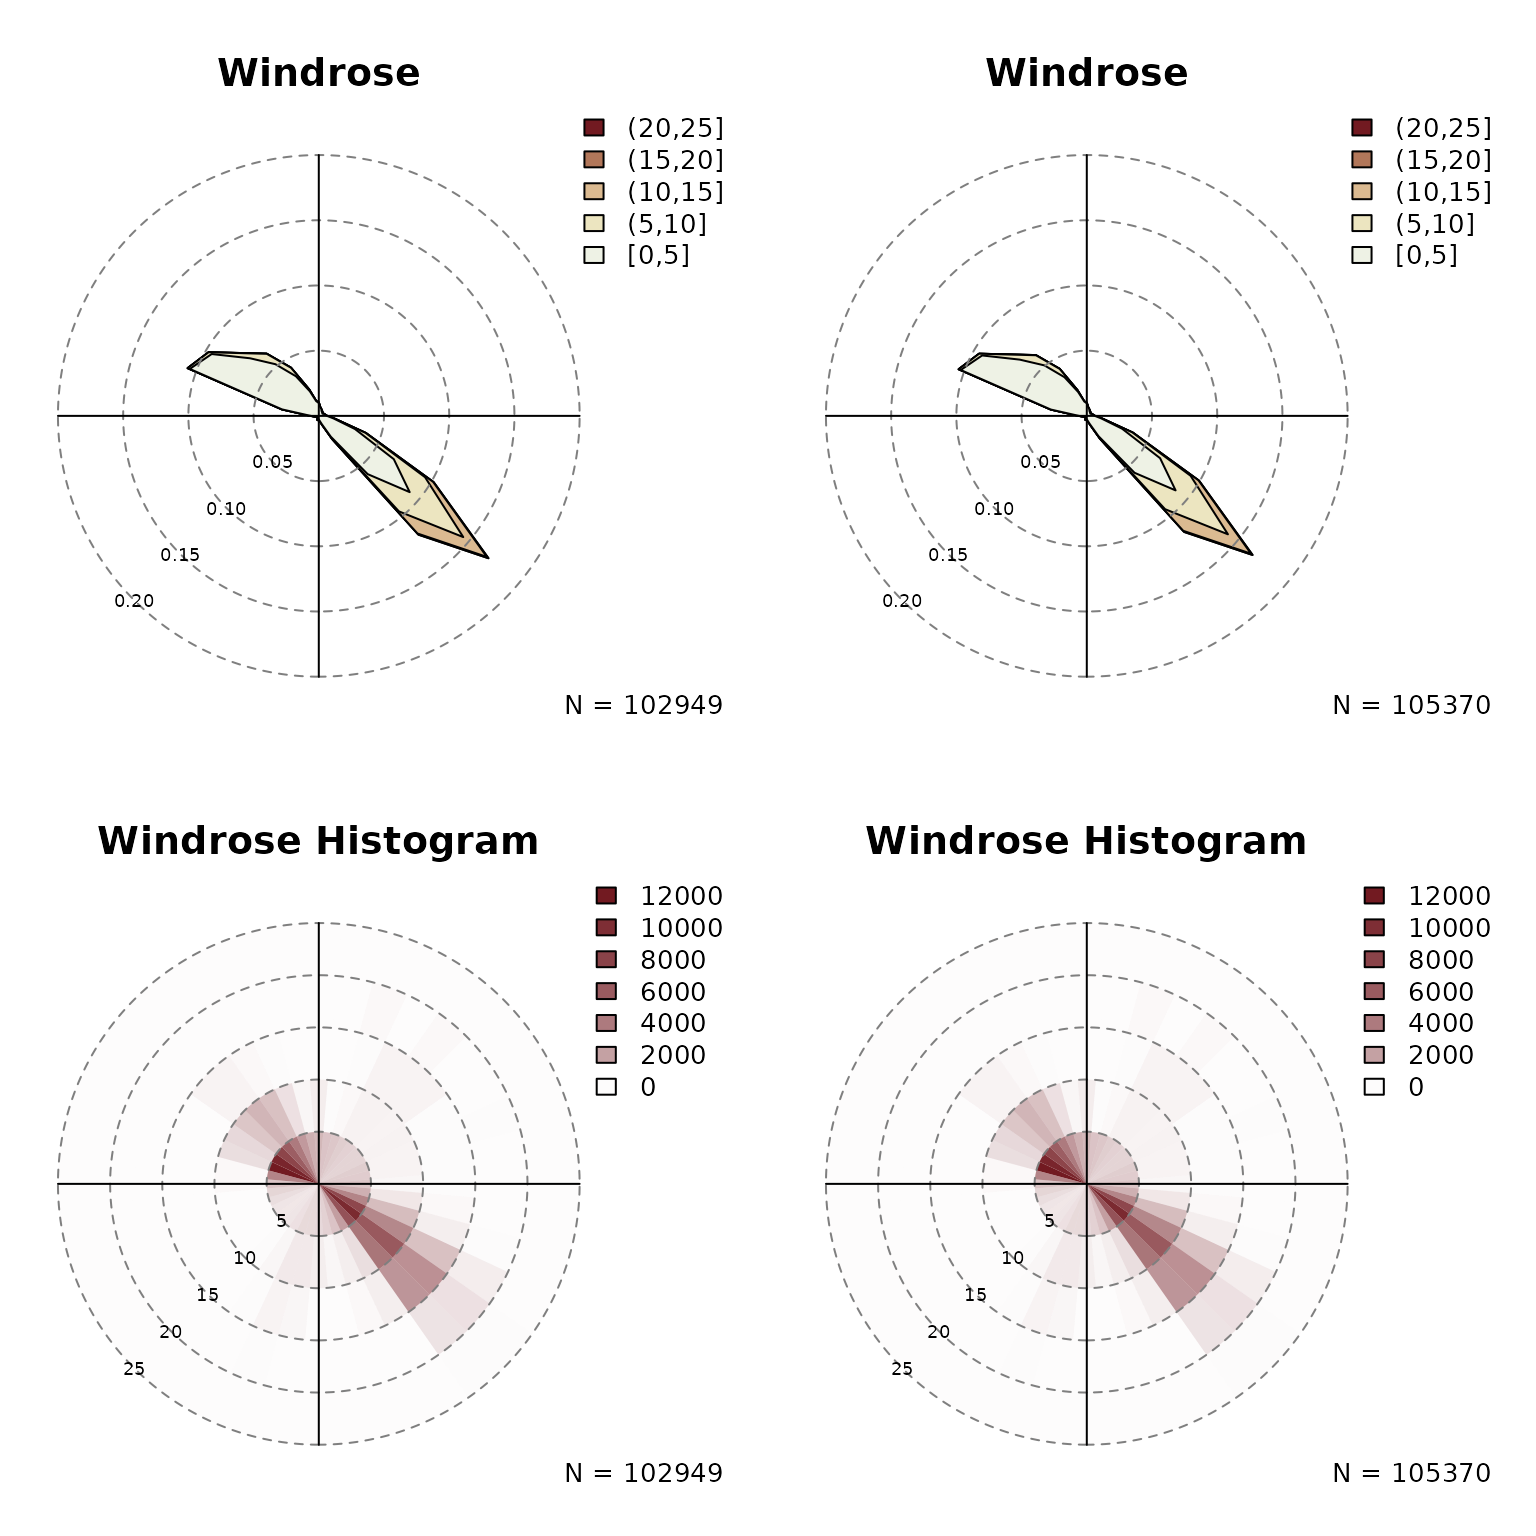
Windrose Plot for foehnix Models
The windrose
function can also directly be applied to foehnix objects. By
default, six windroses will be plotted:
- top row: density plot
- bottom row: circular histograms
- left to right: unconditional, for and
Unconditional is the same as if one would call the windrose function on
the data set (data), the latter two show the windrose
conditional on the foehn probability estimated by the foehnix
classification model.
# Loading the demo data set for Tyrol (Ellboegen and Innsbruck)
data <- demodata("tyrol")

# Estimate a foehnix classification model
filter <- list(dd = c(43, 223), crest_dd = c(90, 270))
mod <- foehnix(diff_t ~ ff + rh, data = data, filter = filter,
               switch = TRUE, verbose = FALSE)

# Plotting windroses
windrose(mod)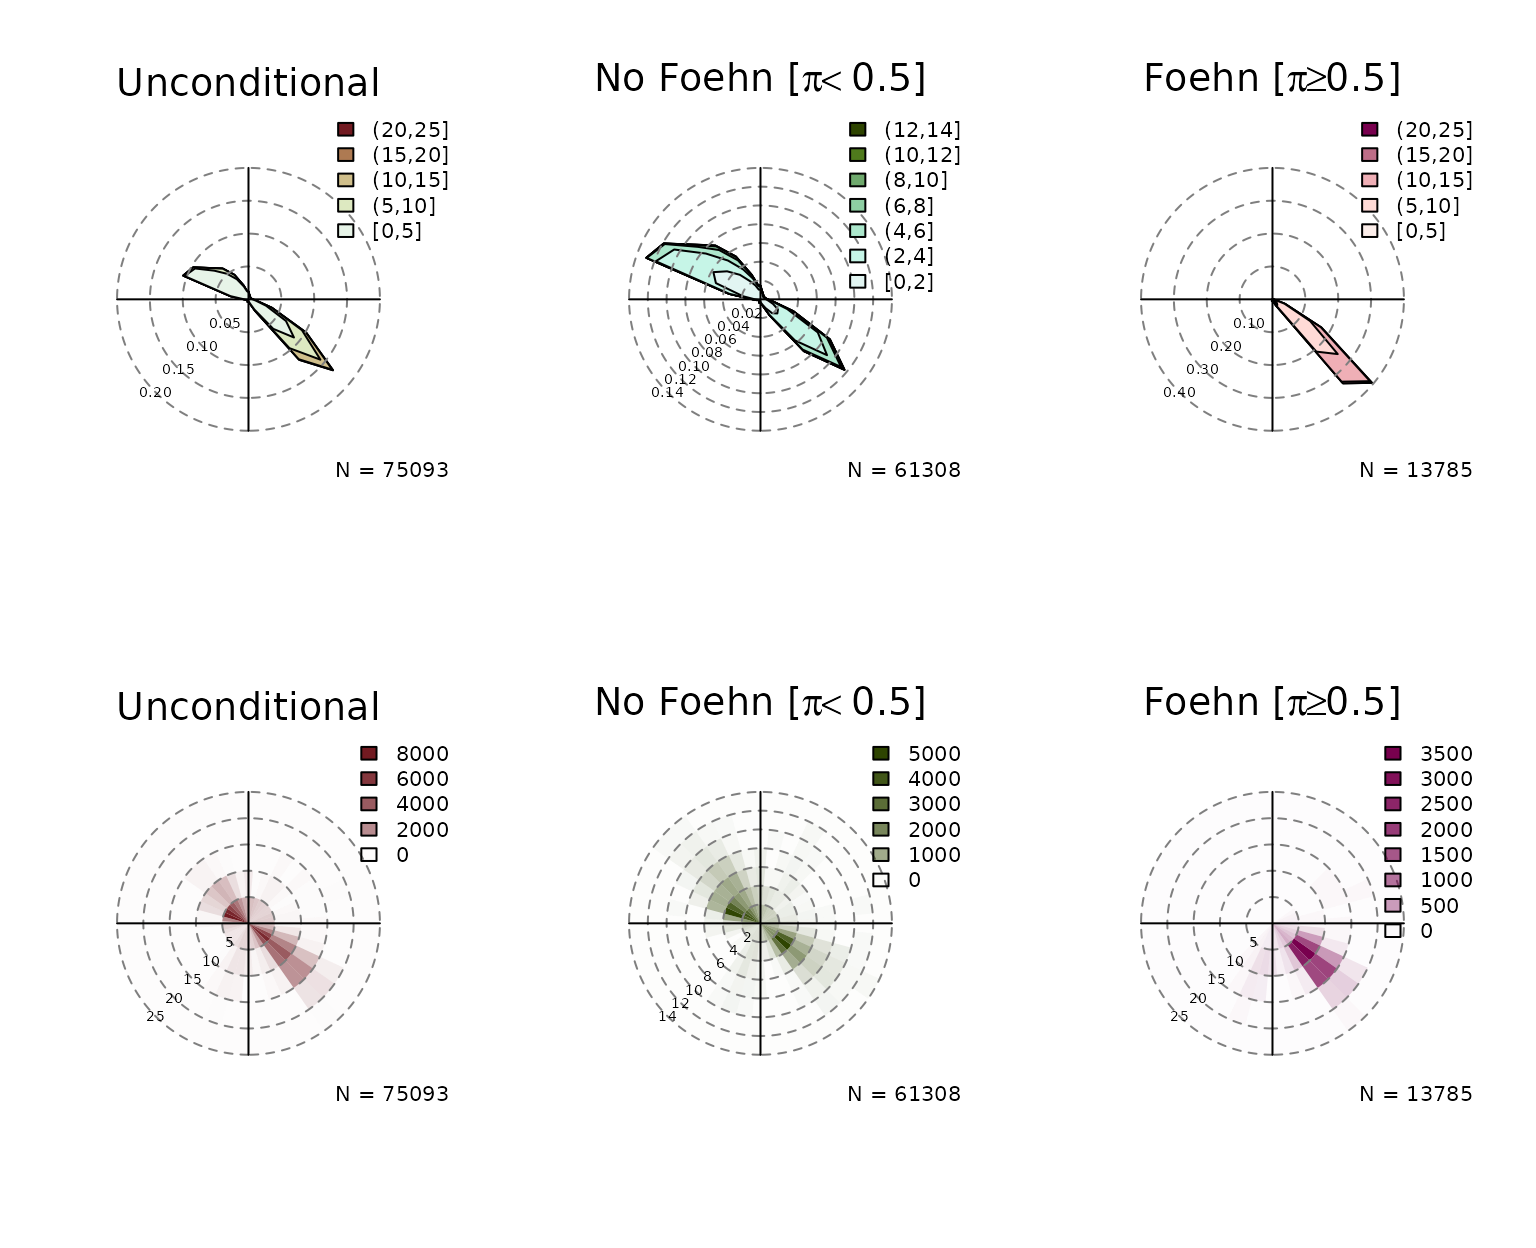
Again, the windrose function
expects that the two variables ‘wind speed’ and ‘wind direction’ are
called ff and dd but can be adjusted if custom
names are used. An example:
# Loading the demo data set for station Ellboegen and Sattelberg (combined)
data <- demodata("tyrol") # default
names(data) <- gsub("dd$", "winddir", names(data))
names(data) <- gsub("ff$", "windspd", names(data))
names(data)
## [1] "winddir" "windspd" "rh" "t"
## [5] "crest_winddir" "crest_windspd" "crest_rh" "crest_t"
## [9] "diff_t"
# Estimate a foehnix classification model using the new
# custom names (see 'foehnix' function documentation for details)
filter <- list(winddir = c(43, 223), crest_winddir = c(90, 270))
mod2 <- foehnix(diff_t ~ windspd + rh, data = data, filter = filter,
                switch = TRUE, verbose = FALSE)

# Plotting windroses using custom names
windrose(mod2, ddvar = "winddir", ffvar = "windspd")
The additional input arguments type and
which allow to specify what should be plotted:
# density plots only
windrose(mod, type = "density", ncol = 3)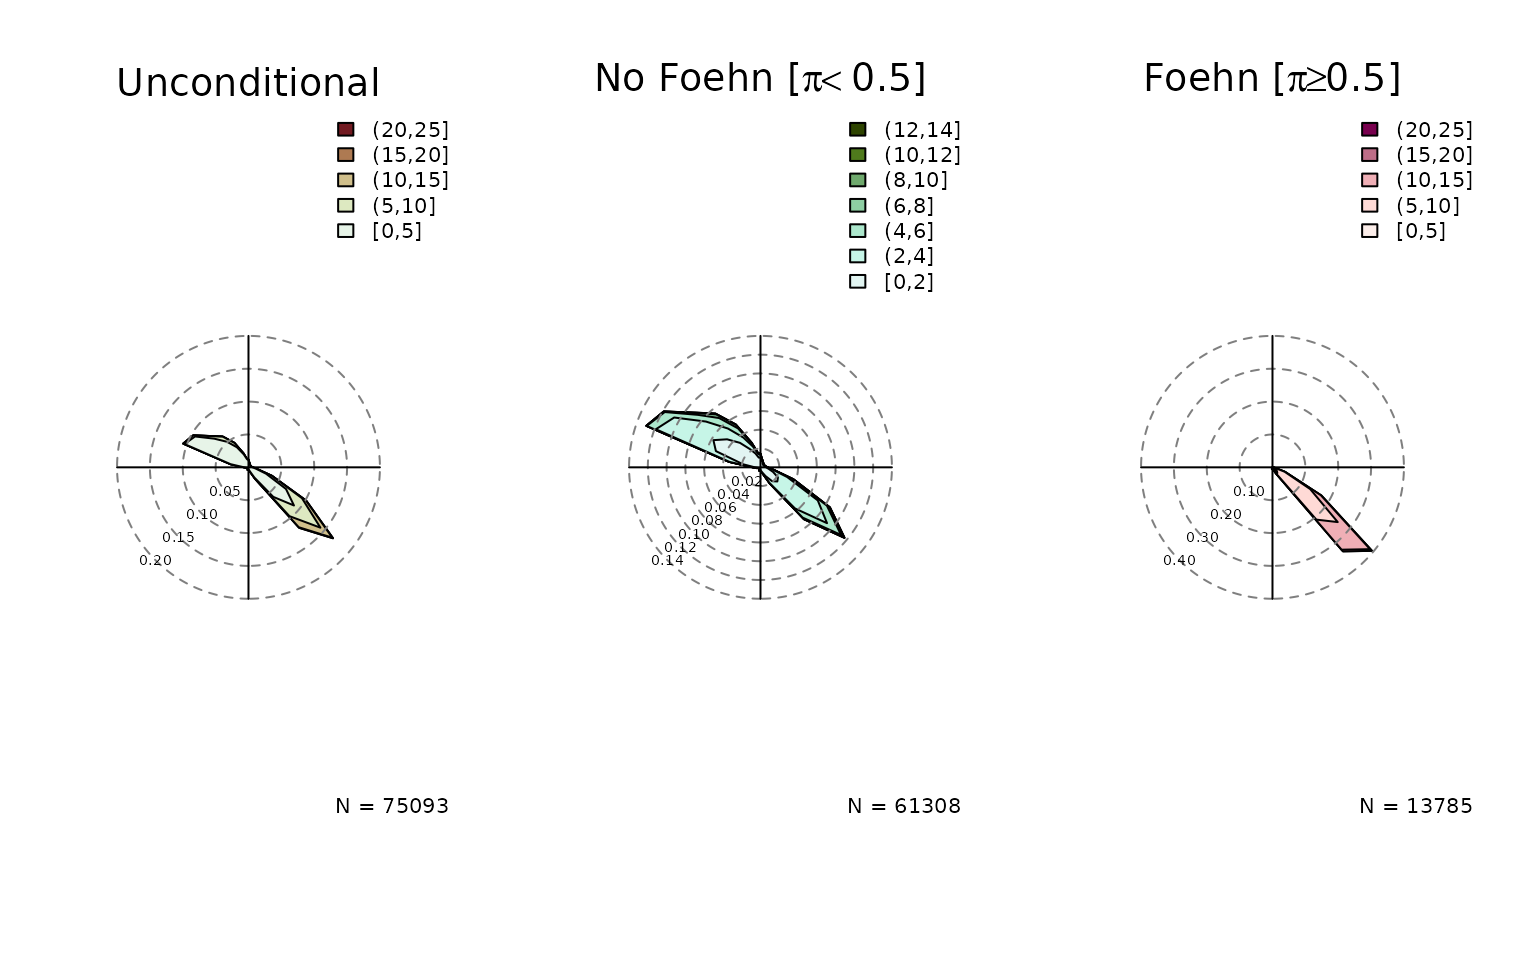
# circular histogram plots only
windrose(mod, type = "histogram", ncol = 3)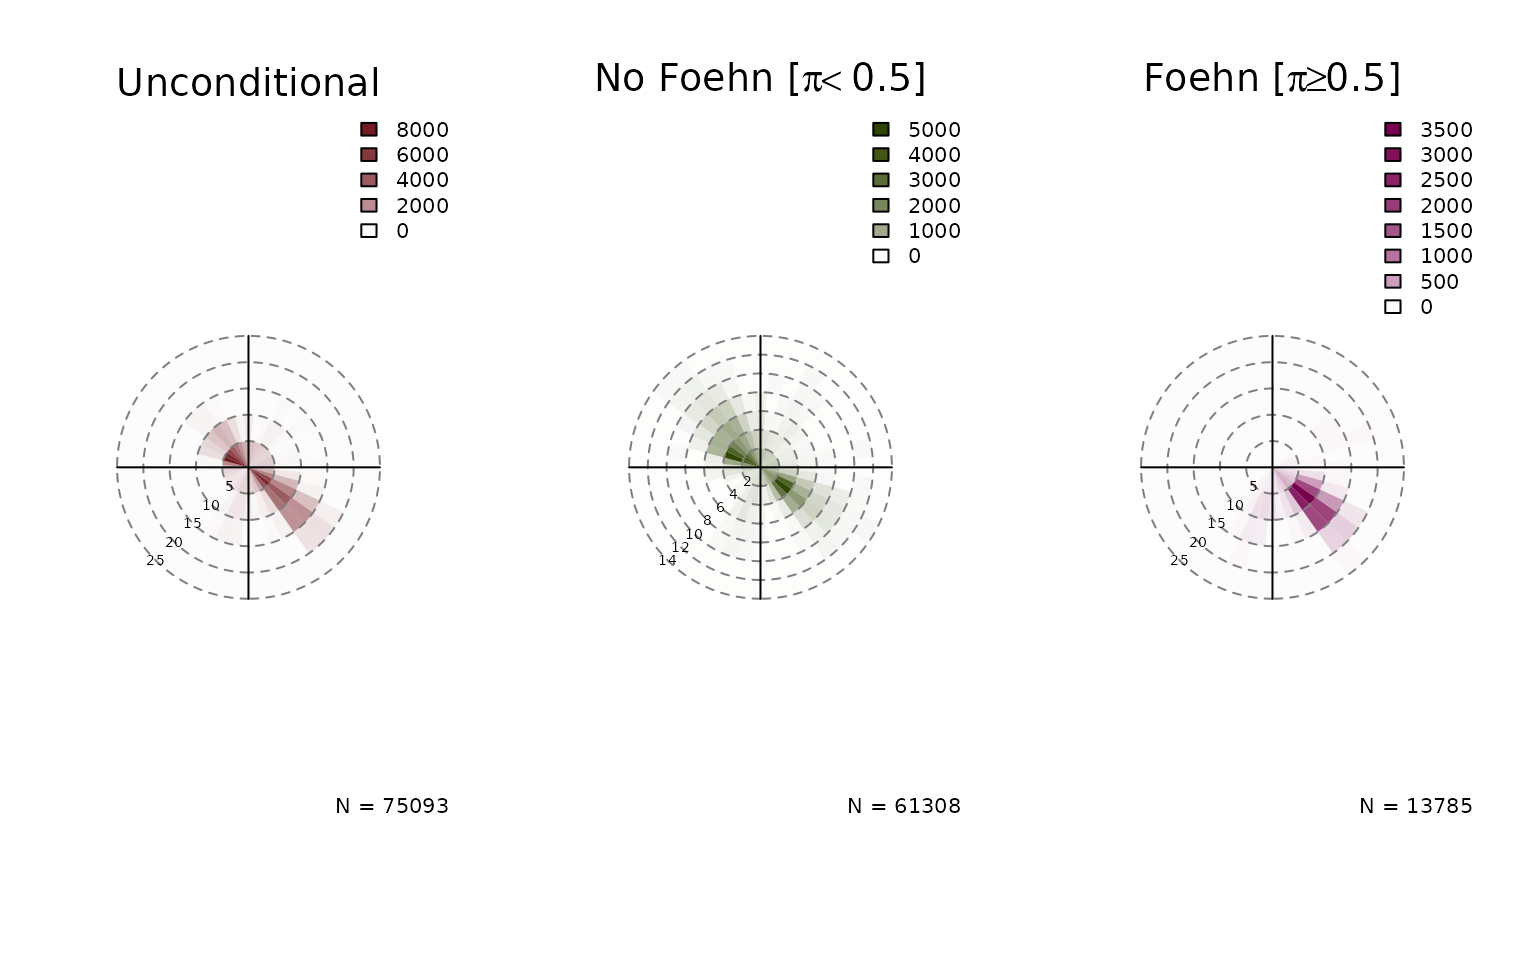
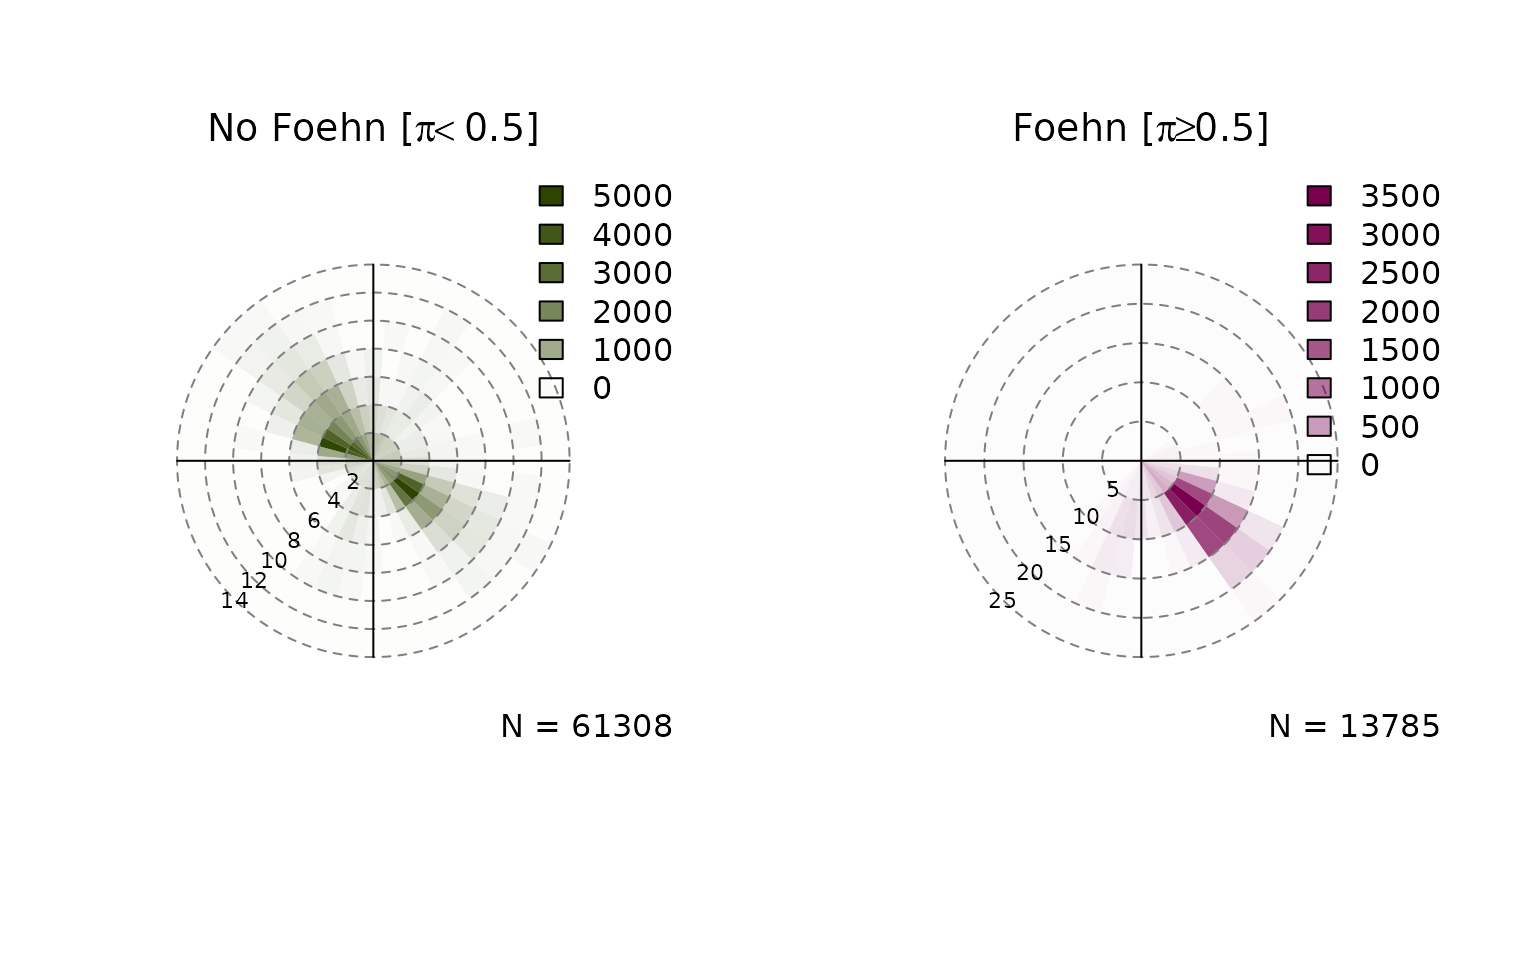
# Only histograms for "foehn" and "no foehN"
windrose(mod, type = "histogram", which = c("nofoehn", "foehn"))